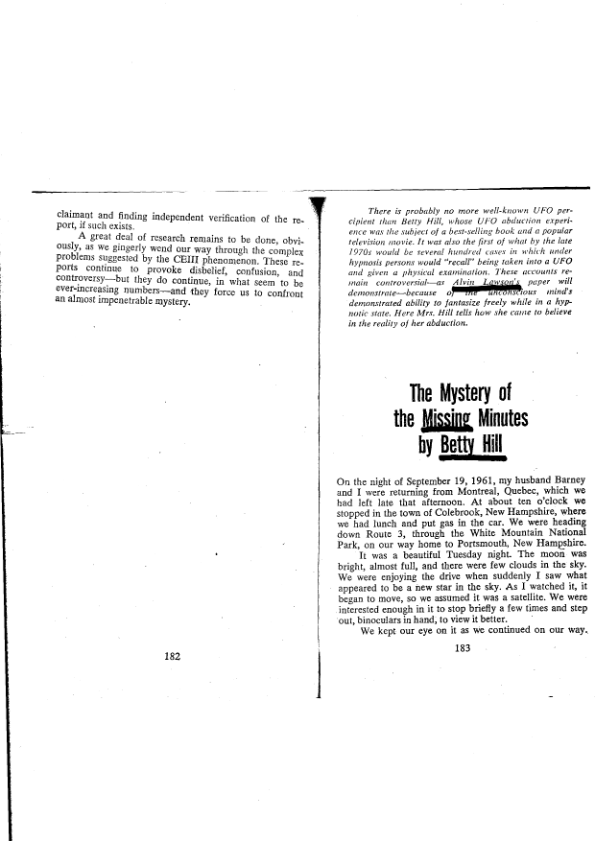
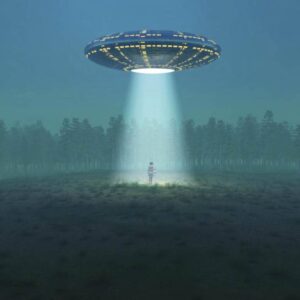
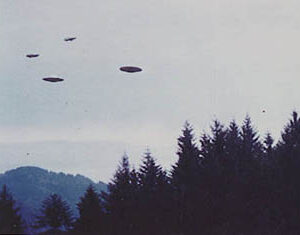
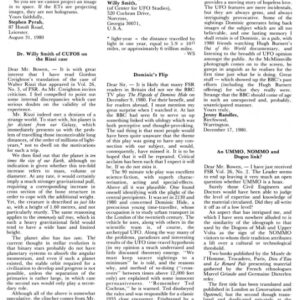
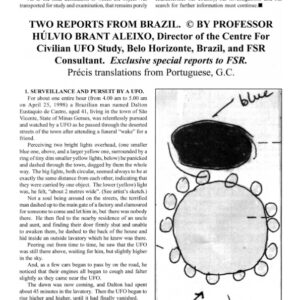
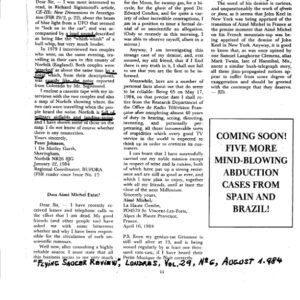
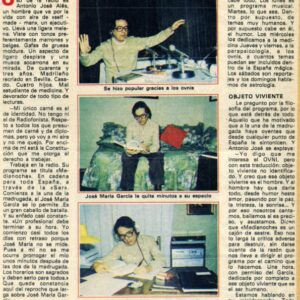
Abduction 1961 Betty Hill
- Descripción
Descripción
Abduction 1961 Betty Hill
Abduction 1961,Betty Hill,A.Lawson
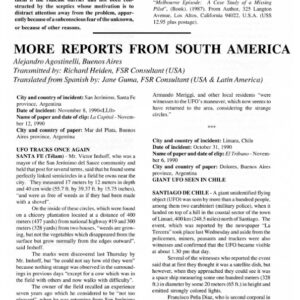
Abduction 1961,Betty Hill,FSR1966V12 N 6


THE ZETA RETICULI INCIDENT By Terence Dickinson with related commentary by: Jeffrey L. Kretsch, Carl Sagan, Steven Soter, Robert Schaeffer, Marjorie Fish, David Saunders, and Michael Peck. (C) 1976 by AstroMedia, Corp., publisher of Astronomy Magazine. A faint pair of stars, 220 trillion miles away, has been tentatively identified as the «home base» of intelligent extraterrestrials who allegedly visited Earth in 1961. This hypothesis is based on a strange, almost bizarre series of events mixing astronomical research with hypnosis, amnesia, and alien humanoid creatures. The two stars are known as Zeta 1 and Zeta 2 Reticuli, or together as simply Zeta Reticuli. They are each fifth magnitude stars — barely visible to the unaided eye — located in the obscure souther constellation Reticulum. This southerly sky location makes Zeta Reticuli invisible to observers north of Mexico City’s latitude. The weird circumstances that we have dubbed «The Zeta Reticuli Incident» sound like they come straight from the UFO pages in one of those tabloids sold in every supermarket. But this is much more than a retelling of a famous UFO incident; it’s an astronomical detective story that at times hovers on that hazy line that separates science from fiction. It all started this way: The date is Sept. 19, 1961. A middle aged New Hampshire couple, Betty and Barney Hill, are driving home from a short vacation in Canada. It’s dark, with the moon and stars illuminating the wooded landscape along U.S. Route 3 in central New Hampshire. The Hills’ curiosity is aroused when a bright «star» seems to move in an irregular pattern. They stop the car for a better view. The object moves closer, and its disklike shape becomes evident. Barney grabs his binoculars from the car seat and steps out. He walks into a field to get a closer look, focuses the binoculars, and sees the object plainly. It has windows — and behind the windows, looking directly at him are…humanoid creatures! Terrified, Barney stumbles back to the car, throws it into first gear and roars off. But for some reason he turns down a side road where five of the humanoids are standing on the road. Apparently unable to control their actions, Betty and Barney are easily taken back to the ship by the humanoids. While inside they are physically examined, and one of the humanoids communicates to Betty. After the examination she asks him where they are from. In response he shows her a three-dimensional map with various sized dots and lines on it. «Where are you on the map?» the humanoid asks Betty. She doesn’t know, so the subject is dropped. Betty and Barney are returned unharmed to their car. They are told they will forget the abduction portion of the incident. The ship rises, and then hurtles out of sight. The couple continue their journey home oblivious of the abduction. But the Hills are troubled by unexplained dreams and anxiety about two hours of their trip that they can’t account for. Betty, a social worker, asks advice from a psychiatrist friend. He suggests that the memory of that time will be gradually restored over the next few months — but it never is. Two years after the incident, the couple are still bothered by the missing two hours, and Barney’s ulcers are acting up. A Boston psychiatrist, Benjamin Simon, is recommended, and after several months of weekly hypnosis sessions the bizarre events of that night in 1961 are revealed. A short time later a UFO group leaks a distorted version of the story to the press and the whole thing blows up. The Hills reluctantly disclose the entire story. Can we take this dramatic scenario seriously? Did this incredible contact with aliens actually occur or is it some kind of hallucination that affected both Barney and Betty Hill? The complete account of the psychiatric examination from which the details of the event emerged is related in John G. Fuller’s ‘The Interrupted Journey’ (Dial Press, 1966), where we read that after the extensive psychiatric examination, Simon concluded that the Hills were not fabricating the story. The most likely possibilities seem to be: (a) the experience actually happened, or (b) some perceptive and illusory misinterpretations occurred in relationship to some real event. There are other cases of alleged abductions by extraterrestrial humanoids. The unique aspect of the Hills’ abduction is that they remembered virtually nothing of the incident. Intrigued by the Hills’ experience, J. Allen Hynek, chairman of the department of astronomy at Northwestern University, decided to investigate. Hynek described how the Hills recalled the details of their encounter in his book, ‘The UFO Experience’ (Henry Regnery Company, 1972): «Under repeated hypnosis they independently revealed what had supposedly happened. The two stories agreed in considerable detail, although neither Betty nor Barney was privy to what the other had said under hypnosis until much later. Under hypnosis they stated that they had been taken separately aboard the craft, treated well by the occupants — rather as humans might treat experimental animals — and then released after having been given the hypnotic suggestion that they would remember nothing of that particular experience. The method of their release supposedly accounted for the amnesia, which was apparently broken only by counterhypnosis.» A number of scientists, including Hynek, have discussed this incident at length with Barney and Betty Hill and have questioned them under hypnosis. They concur with Simon’s belief that there seems to be no evidence of outright fabrication or lying. One would also wonder what Betty, who has a master’s degree in social work and is a supervisor in the New Hampshire Welfare Department, and Barney, who was on the governor of New Hampshire’s Civil Rights Commission, would have to gain by a hoax? Although the Hills didn’t, several people have lost their jobs after being associated with similarly unusual publicity. Stanton T. Friedman, a nuclear physicist and the nation’s only space scientist devoting full time to researching the UFO phenomenon, has spent many hours in conversation with the Hills. «By no stretch of the imagination could anyone who knows them conclude that they were nuts,» he emphasizes. So the experience remains a fascinating story despite the absence of proof that it actually happened. Anyway — that’s where things were in 1966 when Marjorie Fish, an Ohio schoolteacher, amateur astronomer and member of Mensa, became involved. She wondered if the objects shown on the map that Betty Hill allegedly observed inside the vehicle might represent some actual pattern of celestial objects. To get more information about the map she decided to visit Betty Hill in the summer of 1969. (Barney Hill died in early 1969.) Here is Ms. Fish’s account of that meeting: «On Aug.4, 1969, Betty Hill discussed the star map with me. Betty explained that she drew the map in 1964 under posthypnotic suggestion. It was to be drawn only if she could remember it accurately, and she was not to pay attention to what she was drawing — which puts it in the realm of automatic drawing. This is a way of getting at repressed or forgotten material and can result in unusual accuracy. She made two erasures showing her conscious mind took control part of the time. «Betty described the map as three-dimensional, like looking through a window. The stars were tinted and glowed. The map material was flat and thin (not a model), and there were no noticeable lenticular lines like one of our three-dimensional processes. (It sounds very much like a reflective hologram.) Betty did not shift her position while viewing it, so we cannot tell if it would give the same three-dimensional view from all positions or if it would be completely three-dimensional. Betty estimated the map was approximately three feet wide and two feet high with the pattern covering most of the map. She was standing about three feet away from it. She said there were many other stars on the map but she only (apparently) was able to specifically recall the prominent ones connected by lines and a small distinctive triangle off to the left. There was no concentration of stars to indicate the Milky Way (galactic plane) suggesting that if it represented reality, it probably only contained local stars. There were no grid lines.» So much for the background material on the Hill incident. (If you want more details on the encounter, see Fuller’s book). For the moment we will leave Marjorie Fish back in 1969 trying to interpret Betty Hill’s reproduction of the map. There is a second major area of background information that we have to attend to before we can properly discuss the map. Unlike the bizarre events just described, the rest is pure astronomy. According to the most recent star catalogs, there are about 1,000 known stars within a radius of 55 light-years of the sun. What are those other stars like? A check of the catalogs shows that most of them are faint stars of relatively low temperature — a class of stars astronomers call main sequence stars. The sun is a main sequence star along with most of the other stars in this part of the Milky Way galaxy, as the following table shows: Main sequence stars 91% White dwarfs 8% Giants and Supergiants 1% Typical giant stars are Arcturus and Capella. Antares and Betelgeuse are members of the ultrarare supergiant class. At the other end of the size and brightness scale the white dwarfs are stellar cinders — the remains of once brilliant suns. For reasons that will soon become clear we can remove these classes of stars from our discussion and concentrate on the main sequence stars whose characteristics are shown in the table. CHARACTERISTICS OF MAIN SEQUENCE STARS Class Proportion Temperature Mass Luminosity Lifespan of Total (Degrees F) (sun=1) (sun=1) (billions yrs) A0 1% 20,000 2.8 60 0.5 Vega A5 15,000 2.2 20 1.0 F0 3% 13,000 1.7 6 2.0 Procyon F5 12,000 1.25 3 4.0 G0 9% 11,000 1.06 1.3 10 Sun G5 10,000 0.92 0.8 15 K0 14% 9,000 0.80 0.4 20 Epsilon Eridani K5 8,000 0.69 0.1 30 M0 73% 7,000 0.48 0.02 75 Proxima Centauri M5 5,000 0.20 0.001 200 =============================================================================== The spectral class letters are part of a system of stellar «fingerprinting» that identifies the main sequence star’s temperature and gives clues to its mass and luminosity. The hottest, brightest and most massive main sequence stars (with rare exceptions) are the A stars. The faintest, coolest and least massive are the M stars. Each class is subdivided into 10 subcategories. For example, an A0 star is hotter, brighter and more massive than an A1 which is above an A2, and so on through A9. This table supplies much additional information and shows how a slightly hotter and more massive star turns out to be much more luminous than the sun, a G2 star. But the bright stars pay dearly for their splendor. It takes a lot of stellar fuel to emit vast quantities of light and heat. The penalty is a short lifespan as a main sequence star. Conversely, the inconspicuous, cool M stars may be around to see the end of the universe — whatever that might be. With all these facts at hand we’re now ready to tackle the first part of the detective story. Let’s suppose we wanted to make our own map of a trip to the stars. We will limit ourselves to the 55 light-year radius covered by the detailed star catalogs. The purpose of the trip will be to search for intelligent life on planets that may be in orbit around these stars. We would want to include every star that would seem likely to have a life-bearing planet orbiting around it. How many of these thousand-odd stars would we include for such a voyage and which direction would we go? (For the moment, we’ll forget about the problem of making a spacecraft that will take us to these stars and we’ll assume that we’ve got some kind of vehicle that will effortlessly transport us to wherever we want to go.) We don’t want to waste our time and efforts — we only want to go to stars that we would think would have a high probability of having planets harboring advanced life forms. This seems like a tall order. How do we even begin to determine which stars might likely have such planets? The first rule will be to restrict ourselves to life as we know it, the kind of life that we are familiar with here on Earth — carbon based life. Science fiction writers are fond of describing life forms based on chemical systems that we have been unable to duplicate here on Earth — such as silicon based life or life based on the ammonium hydroxide molecule instead of on carbon. But right now these life forms are simply fantasy — we have no evidence that they are in fact possible. Because we don’t even know what they might look like — if they’re out there — we necessarily have to limit our search to the kind of life that we understand. Our kind of life — life as we know it — seems most likely to evolve on a planet that has a stable temperature regime. It must be at the appropriate distance from its sun so that water is neither frozen nor boiled away. The planet has to be the appropriate size so that its gravity doesn’t hold on to too much atmosphere (like Jupiter) or too little (like Mars). But the main ingredient in a life-bearing planet is its star. And its star is the only thing we can study since planets of other stars are far too faint to detect directly. The conclusion we can draw is this: The star has to be like the sun. Main sequence stars are basically stable for long periods of time. As shown in the table, stars in spectral class G have stable lifespans of 10 billion years. (Our sun, actually a G2 star, has a somewhat longer stable life expectancy of 11 billion years.) We are about five billion years into that period so we can look forward to the sun remaining much as it is (actually it will brighten slightly) for another six billion years. Stars of class F4 or higher have stable burning periods of less than 3.5 billion years. They have to be ruled out immediately. Such stars cannot have life-bearing planets because, at least based on our experience on our world, this is not enough time to permit highly developed biological systems to evolve on the land areas of a planet. (Intelligent life may very well arise earlier in water environments, but let’s forget that possibility since we have not yet had meaningful communication with the dolphins — highly intelligent creatures on this planet!) But we may be wrong in our estimate of life development time. There is another more compelling reason for eliminating stars of class F4 and brighter. So far, we have assumed all stars have planets, just as our sun does. Yet spectroscopic studies of stars of class F4 and brighter reveal that most of them are in fact unlike our sun in a vital way — they are rapidly rotating stars. The sun rotates once in just under a month, but 60 percent of the stars in the F0 to F4 range rotate much faster. And almost all A stars are rapid rotators too. It seems, from recent studies of stellar evolution that slowly rotating stars like the sun rotate slowly because they have planets. Apparently the formation of a planetary system robs the star of much of its rotational momentum. For two reasons, then, we eliminate stars of class F4 and above: (1) most of them rotate rapidly and thus seem to be planetless, and (2) their stable lifespans are too brief for advanced life to develop. Another problem environment for higher forms of life is the multiple star system. About half of all stars are born in pairs, or small groups of three or more. Our sun could have been part of a double star system. If Jupiter was 80 times more massive it would be an M6 red dwarf star. If the stars of a double system are far enough apart there is no real problem for planets sustaining life (see «Planet of the Double Sun», September 1974). But stars in fairly close or highly elliptical orbits would alternately fry or freeze their planets. Such planets would also likely have unstable orbits. Because this is a potentially troublesome area for our objective, we will eliminate all close and moderately close pairs of systems of multiple stars. Further elimination is necessary according to the catalogs. Some otherwise perfect stars are labeled «variable». This means astronomers have observed variations of at least a few percent in the star’s light output. A one percent fluctuation in the sun would be annoying for us here on Earth. Anything greater would cause climatic disaster. Could intelligent life evolve under such conditions, given an otherwise habitable planet? It seems unlikely. We are forced to «scratch» all stars suspected or proven to be variable. This still leaves a few F stars, quite a few G stars, and hoards of K and M dwarfs. Unfortunately most of the Ks and all of the Ms are out. Let’s find out why. These stars quite likely have planets. Indeed, one M star — known as Barnard’s star — is believed to almost certainly have at least one, and probably two or three, Jupiter sized planets. Peter Van de Kamp of the Sproul Observatory at Swarthmore College (Pa.) has watched Barnard’s star for over three decades and is convinced that a «wobbling» motion of that star is due to perturbations (gravitational «pulling and pushing») caused by its unseen planets. (Earth sized planets cannot be detected in this manner.) But the planets of M stars and the K stars below K4 have two serious handicaps that virtually eliminate them from being abodes for life. First, these stars fry their planets with occasional lethal bursts of radiation emitted from erupting solar flares. The flares have the same intensity as those of our sun, but when you put that type of flare on a little star it spells disaster for a planet that is within, say, 30 million miles. The problem is that planets have to be that close to get enough heat from these feeble suns. If they are farther out, they have frozen oceans and no life. The close-in orbits of potential Earthlike planets of M and faint K stars produce the second dilemma — rotational lock. An example of rotational lock is right next door to us. The moon, because of its nearness to Earth, is strongly affected by our planet’s tidal forces. Long ago our satellite stopped rotating and now has one side permanently turned toward Earth. The same principles apply to planets of small stars that would otherwise be at the right distance for moderate temperatures. If rotational lock has not yet set in, at least rotational retardation would make impossibly long days and nights (as evidenced by Mercury in our solar system). What stars are left after all this pruning? All of the G stars remain along with F5 through F9 and K0 through K4. Stephen Dole of the Rand Corporation has made a detailed study of stars in this range and suggests we should also eliminate F5, F6 and F7 stars because they balloon to red giants before they reach an age of five billion years. Dole feels this is cutting it too fine for intelligent species to fully evolve. Admittedly this is based on our one example of intelligent life — us. But limited though this parameter is, it is the only one we have. Dole believes the K2, K3 and K4 stars are also poor prospects because of their feeble energy output and consequently limited zone for suitable Earthlike planets. Accepting Dole’s further trimming we are left with single, nonvariable stars from F8 through all the Gs to K1. What does that leave us with? Forty-six stars. Now we are ready to plan the trip. It’s pretty obvious that Tau Ceti is our first target. After that, the choice is more difficult. We can’t take each star in order or we would be darting all over the sky. It’s something like planning a vacation trip. Let’s say we start from St. Louis and want to hit all the major cities within a 1,000 mile radius. If we go west, all we can visit is Kansas City and Denver. But northeast is a bonanza: Chicago, Detroit, Cleveland, Pittsburgh, Philadelphia, New York and more. The same principle applies to the planning of our interstellar exploration. The plot of all 46 candidate stars reveals a clumping in the direction of the constellations Cetus and Eridanus. Although this section amounts to only 13 percent of the entire sky, it contains 15 of the 46 stars, or 33 percent of the total. Luckily Tau Ceti is in this group, so that’s the direction we should go (comparable to heading northeast from St. Louis). If we plan to visit some of these solar type stars and then return to Earth, we should try to have the shortest distance between stops. It would be a waste of exploration time if we zipped randomly from one star to another. Now we are ready to return to the map drawn by Betty Hill. Marjorie Fish reasoned that if the stars in the Hill map corresponded to a patter of real stars — perhaps something like we just developed, only from an alien’s viewpoint — it might be possible to pinpoint the origin of the alleged space travelers. Assuming the two stars in the foreground of the Hill map were the «base» stars (the sun, a single star, was ruled out here), she decided to try to locate the entire pattern. She theorized that the Hill map contained only local stars since no concentration would be present if a more distant viewpoint was assumed and if both «us» and the alien visitors’ home base were to be represented. Let’s assume, just as an astronomical exercise, that the map does show the sun and the star that is «the sun» to the humanoids. We’ll take the Hill encounter at face value, and see where it leads. Since the aliens were described as «humanoid» and seemed reasonably comfortable on this planet, their home planet should be basically like ours. Their atmosphere must be similar because the Hills breathed without trouble while inside the ship, and the aliens did not appear to wear any protective apparatus. And since we assume their biology is similar to ours, their planet should have the same temperature regime as Earth (Betty and Barney did say it was uncomfortably cold in the ship). In essence, then, we assume their home planet must be very Earthlike. Based on what we discussed earlier it follows that their sun would be on our list if it were within 55 light-years of us. The lines on the map, according to Betty Hill, were described by the alien as «trade routes» or «places visited occasionally» with the dotted lines as «expeditions». Any interpretation of the Betty Hill map must retain the logic of these routes (i.e. the lines would link stars that would be worth visiting). Keeping all this in mind, Marjorie Fish constructed several three-dimensional models of the solar neighborhood in hopes of detecting the pattern in the Hill map. Using beads dangling on threads, she painstakingly recreated our stellar environment. Between Aug. 1968 and Feb. 1973, she strung beads, checked data, searched and checked again. A suspicious alignment, detected in late 1968, turned out to be almost a perfect match once new data from the detailed 1969 edition of the Catalog of Nearby Stars became available. (This catalog is often called the «Gliese catalog» — pronounced «glee-see» — after its principal author, Wilhelm Gliese.) ============================================================================== THE 46 NEAREST STARS SIMILAR TO THE SUN NAME DISTANCE MAGNITUDE LUMINOSITY SPECTRUM (light-years) (visual) (sun=1) Tau Ceti 11.8 3.5 0.4 G8 82 Eridani 20.2 4.3 0.7 G5 Zeta Tucanae 23.3 4.2 0.9 G2 107 Piscium 24.3 5.2 0.4 K1 Beta Comae Berenices 27.2 4.3 1.2 G0 61 Virginis 27.4 4.7 0.8 G6 Alpha Mensae 28.3 5.1 0.6 G5 Gliese 75 28.6 5.6 0.4 K0 Beta Canum Venaticorum 29.9 4.3 1.4 G0 Chi Orionis 32 4.4 1.5 G0 54 Piscium 34 5.9 0.4 K0 Zeta 1 Reticuli 37 5.5 0.7 G2 Zeta 2 Reticuli 37 5.2 0.9 G2 Gliese 86 37 6.1 0.4 K0 Mu Arae 37 5.1 0.9 G5 Gliese 67 38 5.0 1.2 G2 Gliese 668.1 40 6.3 0.4 G9 Gliese 302 41 6.0 0.6 G8 Gliese 309 41 6.4 0.4 K0 Kappa Fornacis 42 5.2 1.3 G1 58 Eridani 42 5.5 0.9 G1 Zeta Doradus 44 4.7 2.0 F8 55 Cancri 44 6.0 0.7 G8 47 Ursa Majoris 44 5.1 1.5 G0 Gliese 364 45 4.9 1.8 G0 Gliese 599A 45 6.0 0.6 G6 Nu Phoenicis 45 5.0 1.8 F8 Gliese 95 45 6.3 0.5 G5 Gliese 796 47 5.6 0.5 G8 20 Leo Minoris 47 5.4 1.2 G4 39 Tauri 47 5.9 0.8 G1 Gliese 290 47 6.6 0.4 G8 Gliese 59.2 48 5.7 1.0 G2 Psi Aurigae 49 5.2 1.5 G0 Gliese 722 49 5.9 0.9 G4 Gliese 788 49 5.9 0.8 G5 Nu 2 Lupi 50 5.6 1.1 G2 14 Herculis 50 6.6 0.5 K1 Pi Ursa Majoris 51 5.6 1.2 G0 Phi 2 Ceti 51 5.2 1.8 F8 Gliese 641 52 6.6 0.5 G8 Gliese 97.2 52 6.9 0.4 K0 Gliese 541.1 53 6.5 0.6 G8 109 Piscium 53 6.3 0.8 G4 Gliese 651 53 6.8 0.4 G8 Gliese 59 53 6.7 0.4 G8 This table lists all known stars within a radius of 54 light-years that are single or part of a wide multiple star system. They have no known irregularities or variabilities and are between 0.4 and 2.0 times the luminosity of the sun. Thus, a planet basically identical to Earth could be orbiting around any one of them. (Data from the Catalog of Nearby Stars, 1969 edition, by Wilhelm Gliese.) =============================================================================== The 16 stars in the stellar configuration discovered by Marjorie Fish are compared with the map drawn by Betty Hill in the diagram on page 6. If some of the star names on the Fish map sound familiar, they should. Ten of the 16 stars are from the compact group that we selected earlier based on the most logical direction to pursue to conduct interstellar exploration from Earth. Continuing to take the Hill map at face value, the radiating pattern of «trade routes» implies that Zeta 1 and Zeta 2 Reticuli are the «hub» of exploration or, in the context of the incident, the aliens’ home base. The sun is at the end of one of the supposedly regular trade routes. The pair of stars that make up Zeta Reticuli is practically in the midst of the cluster of solar type stars that attracted us while we were mapping out a logical interstellar voyage. Checking further we find that all but two of the stars in the Fish pattern are on the table of nearby solar type stars. These two stars are Tau 1 Eridani (an F6 star) and Gliese 86.1 (K2), and are, respectively, just above and below the parameters we arrived at earlier. One star that should be there (Zeta Tucanae) is missing probably because it is behind Zeta 1 Reticuli at the required viewing angle. To summarize, then: (1) the pattern discovered by Marjorie Fish has an uncanny resemblance to the map drawn by Betty Hill; (2) the stars are mostly the ones that we would visit if we were exploring from Zeta Reticuli, and (3) the travel patterns generally make sense. Walter Mitchell, professor of astronomy at Ohio State University in Columbus, has looked at Marjorie Fish’s interpretation of the Betty Hill map in detail and tells us, «The more I examine it, the more I am impressed by the astronomy involved in Marjorie Fish’s work.» During their examination of the map, Mitchell and some of his students inserted the positions of hundreds of nearby stars into a computer and had various space vistas brought up on a cathode ray tube readout. They requested the computer to put them in a position out beyond Zeta Reticuli looking toward the sun. From this viewpoint the map pattern obtained by Marjorie Fish was duplicated with virtually no variations. Mitchell noted an important and previously unknown fact first pointed out by Ms. Fish: The stars in the map are almost in a plane; that is, they fill a wheel shaped volume of space that makes star hopping from one to another easy and the logical way to go — and that is what is implied by the map that Betty Hill allegedly saw. «I can find no major point of quibble with Marjorie Fish’s interpretation of the Betty Hill map,» says David R. Saunders, a statistics expert at the Industrial Relations Center of the University of Chicago. By various lines of statistical reasoning he concludes that the chances of finding a match among 16 stars of a specific spectral type among the thousand-odd stars nearest the sun is «at least 1,000 to 1 against». «The odds are about 10,000 to 1 against a random configuration matching perfectly with Betty Hill’s map,» Saunders reports. «But the star group identified by Marjorie Fish isn’t quite a perfect match, and the odds consequently reduce to about 1,000 to 1. That is, there is one chance in 1,000 that the observed degree of congruence would occur in the volume of space we are discussing. «In most fields of investigation where similar statistical methods are used, that degree of congruence is rather persuasive,» concludes Saunders. Saunders, who has developed a monumental computerized catalog of more than 60,000 UFO sightings, tells us that the Hill case is not unique in its general characteristics — there are other known cases of alleged communication with extraterrestrials. But in no other case on record have maps ever been mentioned. Mark Steggert of the Space Research Coordination Center at the University of Pittsburgh developed a computer program that he calls PAR (for Perspective Alteration Routine) that can duplicate the appearance of star fields from various viewpoints in space. «I was intrigued by the proposal put forth by Marjorie Fish that she had interpreted a real star pattern for the alleged map of Betty Hill. I was incredulous that models could be used to do an astronometric problem,» Steggert says. «To my surprise I found that the pattern that I derived from my program had a close correspondence to the data from Marjorie Fish.» After several run-throughs, he confirmed the positions determined by Marjorie Fish. «I was able to locate potential areas of error, but no real errors,» Steggert concludes. Steggert zeroed in on possibly the only real bone of contention that anyone has had with Marjorie Fish’s interpretation: The data on some of the stars may not be accurate enough for us to make definitive conclusions. For example, he says the data from the Smithsonian Astrophysical Observatory Catalog, the Royal Astronomical Society Observatory Catalog, and the Yale Catalog of Bright Stars «have differences of up to two magnitudes and differences in distance amounting to 40 percent for the star Gliese 59». Other stars have less variations in the data from one catalog to another, but Steggert’s point is valid. The data on some of the stars in the map is just not good enough to make a definitive statement. (The fact that measurements of most of the stars in question can only be made at the relatively poor equipped southern hemisphere observatories accounts for the less reliable data.) Using information on the same 15 stars from the Royal Observatory catalog (Annals #5), Steggert reports that the pattern does come out differently because of the different data, and Gliese 59 shows the largest variation. The Gliese catalog uses photometric, trigonometric and spectroscopic parallaxes and derives a mean from all three after giving various mathematical weights to each value. «The substantial variation in catalog material is something that must be overcome,» says Steggert. «This must be the next step in attempting to evaluate the map.» This point of view is shared by Jeffrey L. Kretsch, an undergraduate student who is working under the advisement of J. Allen Hynek at Northwestern University in Evanston, Ill. Like Steggert, he too checked Marjorie Fish’s pattern and found no error in the work. But Kretsch reports that when he reconstructed the pattern using trigonometric distance measurements instead of the composite measures in the Gliese catalog, he found enough variations to move Gliese 95 above the line between Gliese 86 and Tau 1 Eridani. «The data for some of the stars seems to be very reliable, but a few of the pattern stars are not well observed and data on them is somewhat conflicting,» says Kretsch. The fact that the pattern is less of a «good fit» using data from other sources leads Kretsch and others to wonder what new observations would do. Would they give a closer fit? Or would the pattern become distorted? Marjorie Fish was aware of the catalog variations, but has assumed the Gliese catalog is the most reliable source material to utilize. Is the Gliese catalog the best available data source. According to several astronomers who specialize in stellar positions, it probably is. Peter Van de Kamp says, «It’s first rate. There is none better.» He says the catalog was compiled with extensive research and care over many years. A lot of the published trigonometric parallaxes on the stars beyond 30 light-years are not as accurate as they could be, according to Kyle Cudworth of Yerkes Observatory. «Gliese added other criteria to compensate and lessen the possible errors,» he says. The scientific director of the U.S. Naval Observatory, K.A. Strand, is among the world’s foremost authorities on stellar distances for nearby stars. He believes the Gliese catalog «is the most complete and comprehensive source available.» Frank B. Salisbury of the University of Utah has also examined the Hill and Fish maps. «The pattern of stars discovered by Marjorie Fish fits the map drawn by Betty Hill remarkably well. It’s a striking coincidence and forces one to take the Hill story more seriously,» he says. Salisbury is one of the few scientists who has spent some time on the UFO problem and has written a book and several articles on the subject. A professor of plant physiology, his biology expertise has been turned to astronomy on several occasions while studying the possibility of biological organisms existing on Mars. Salisbury insists that while psychological factors do play an important role in UFO phenomena, the Hill story does represent one of the most credible reports of incredible events. The fact that the story and the map came to light under hypnosis is good evidence that it actually took place. «But it is not unequivocal evidence,» he cautions. Elaborating on this aspect of the incident, Mark Steggert offers this: «I am inclined to question the ability of Betty, under posthypnotic suggestion, to duplicate the pattern two years after she saw it. She noted no grid lines on the pattern for reference. Someone should (or perhaps has already) conduct a test to see how well a similar patter could be recalled after a substantial period of time. The stress she was under at the time is another unknown factor.» «The derivation of the base data by hypnotic techniques is perhaps not as ‘far out’ as it may seem,» says Stanton Friedman. «Several police departments around the country use hypnosis on rape victims in order to get descriptions of the assailants — descriptions that would otherwise remain repressed. The trauma of such circumstances must be comparable in some ways to the Hill incident.» Is it at all possible we are faced with a hoax? «Highly unlikely,» says Salisbury — and the other investigators agree. One significant fact against a charade is that the data from the Gliese catalog was not published until 1969, five years after the star map was drawn by Betty Hill. Prior to 1969, the data could only have been obtained from the observatories conducting research on the specific stars in question. It is not uncommon for astronomers not to divulge their research data — even to their colleagues — before it appears in print. In general, the entire sequence of events just does not smell of falsification. Coincidence, possibly; hoax, improbable. Where does all this leave us? Are there creatures inhabiting a planet of Zeta 2 Reticuli? Did they visit Earth in 1961? The map indicates that the sun has been «visited occasionally». What does that mean? Will further study and measurement of the stars in the map change their relative positions and thus distort the configuration beyond the limits of coincidence? The fact that the entire incident hinges on a map drawn under less than normal circumstances certainly keeps us from drawing a firm conclusion. Exobiologists are united in their opinion that the chance of us having neighbors so similar to us, apparently located so close, is vanishingly small. But then, we don’t even know for certain if there is anybody at all out there — anywhere — despite the Hill map and pronouncements of the most respected scientists. The only answer is to continue the search. Someday, perhaps soon, we will know. ================================================================= THE VIEW FROM ZETA RETICULI The two stars that comprise the Zeta Reticuli system are almost identical to the sun. Thy are the only known examples of two solar type stars apparently linked into a binary star system of wide separation. Zeta 1 is separated from Zeta 2 by at least 350 billion miles — about 100 times the sun-Pluto distance. They may be even farther apart, but the available observations suggest they are moving through space together and are therefore physically associated. They probably require at least 100,000 years to orbit around their common center of gravity. Both Zeta 1 and Zeta 2 are prime candidates for the search for life beyond Earth. According to our current theories of planetary formation, they both should have a retinue of planets something like our solar system. As yet there is no way of determining if any of the probable planets of either star is similar to Earth. To help visualize the Zeta Reticuli system, let’s take the sun’s nine planets and put them in identical orbits around Zeta 2. From a celestial mechanics standpoint there is no reason why this situation could not exist. Would anything be different? Because of Zeta 2’s slightly smaller mass as compared with the sun, the planets would orbit a little more slowly. Our years might have 390 days, for example. Zeta 2 would make a fine sun – – slightly dimmer than «old Sol», but certainly capable of sustaining life. The big difference would not be our new sun but the superstar of the night sky. Shining like a polished gem, Zeta 1 would be the dazzling highlight of the night sky — unlike anything we experience here on Earth. At magnitude -9 it would appear as a starlike point 100 times brighter than Venus. It would be like compressing all the light from the first quarter moon into a point source. Zeta 1 would have long ago been the focus of religions, mythology and astrology if it were in earthly skies. The fact that it would be easily visible in full daylight would give Zeta 1 supreme importance to both early civilizations and modern man. Shortly after the invention of the telescope astronomers would be able to detect Jupiter and Saturn sized planets orbiting around Zeta 1. Jupiter would be magnitude +12, visible up to 4.5 minutes of arc from Zeta 1 (almost as far as Ganymede swings from Jupiter). It would not make a difficult target for an eight inch telescope. Think of the incentive that discovery would have on interstellar space travel! For hundreds of years we would be aware of another solar system just a few «light-weeks» away. The evolution of interstellar spaceflight would be rapid, dynamic and inevitable. By contrast, our nearest solar type neighbor is Tau Ceti at 12 light-years. Even today we only suspect it is accompanied by a family of planets, but we don’t know for sure. From this comparison of our planetary system with those of Zeta Reticuli, it is clear that any emerging technologically advanced intelligent life would probably have great incentive to achieve star flight. The knowledge of a nearby system of planets of a solar type star would be compelling — at least it would certainly seem to be. What is so strange — and this question prompted us to prepare this article — is: Why, of all stars, does Zeta Reticuli seem to fit as the hub of a map that appeared inside a spacecraft that allegedly landed on Earth in 1961? Some of the circumstances surrounding the whole incident are certainly bizarre, but not everything can be written off as coincidence or hallucination. It may be optimistic, on one extreme, to hope that our neighbors are as near as 37 light-years away. For the moment we will be satisfied with considering it an exciting possibility. ================================================================= THE AGE OF NEARBY STARS By Jeffrey L. Kretsch The age of our own sun is known with some accuracy largely because we live on one of its planets. Examination of Earth rocks — and, more recently, rocks and soil from the moon — has conclusively shown that these two worlds went through their initial formation 4.6 billion years ago. The formation of the sun and planets is believed to have been virtually simultaneous, with the sun’s birth producing the planetary offspring. But we have yet to travel to any other planet — and certainly a flight to the surface of a planet of a nearby star is an event no one reading this will live to witness. So direct measurement of the ages of nearby stars — as a by-product of extrasolar planetary exploration — is a distant future enterprise. We are left with information obtained from our vantage point here near Earth. There is lots of it — so let’s find out what it is and what it can tell us. When we scan the myriad stars of the night sky, are we looking at suns that have just ignited their nuclear fires — or have they been flooding the galaxy with light for billions of years? The ages of the stars are among the most elusive stellar characteristics. Now, new interpretation of data collected over the past half century is shedding some light on this question. Computer models of stellar evolution reveal that stars have definite lifespans; thus, a certain type of star cannot be older than its maximum predicted lifespan. Solar type stars of spectral class F5 or higher (hotter) cannot be older than our sun is today. These stars’ nuclear fires burn too rapidly to sustain them for a longer period, and they meet an early death. All main sequence stars cooler than F5 can be as old or older than the sun. Additionally, these stars are also much more likely to have planets than the hotter suns. There are several exciting reasons why the age of a star should be tracked down. Suppose we have a star similar to the sun (below class F5). If we determine how old the star is, we can assume its planets are the same age — a fascinating piece of information that suggests a host of questions: Would older Earthlike planets harbor life more advanced than us? Is there anything about older or younger stars and planets that would make them fundamentally different from the sun and Earth? Of course we don’t know the answer to the first question, but it is provocative. The answer to the second question seems to be yes (according to the evidence that follows). To best illustrate the methods of star age determination and their implications, let’s select a specific problem. «The Zeta Reticuli Incident» sparked more interest among our readers than any other single article in ASTRONOMY’s history. Essentially, that article drew attention to a star map allegedly seen inside an extraterrestrial spacecraft. The map was later deciphered by Marjorie Fish, now a research assistant at Oak Ridge National Laboratory in Tennessee. In her analysis, Ms. Fish linked all 16 prominent stars in the original map (which we’ll call the Hill map since it was drawn by Betty Hill in 1966) to 15 real stars in the southern sky. The congruence was remarkable. The 15 stars — for convenience we will call them the Fish-Hill pattern stars — are listed on the accompanying table. Since these stars have been a focus of attention due to Ms. Fish’s work and the article mentioned above, we will examine them specifically to see if enough information is available to pin down their ages and (possibly) other characteristics. This will be our case study star group. ============================================================================== THE FISH-HILL PATTERN STARS GLIESE ALTERNATE SPECTRAL W – TOTAL GALACTIC GALACTIC CAT. NO. NAME TYPE VELOCITY SPACE ORBIT ORBIT VELOCITY ECCENTRICITY INCL. ——– ——— ——– ——– ——– ———— ——– 17 Zeta Tucanae G2 -38 70 0.1575 .0529 27 54 Piscium K0 10 45 0.1475 .0260 59 HD 9540 G8 1 26 0.0436 .0133 67 HD 10307 G2 0 45 0.1057 .0092 68 107 Piscium K1 3 43 0.1437 .0134 71 Tau Ceti G8 12 36 0.2152 .0287 86 HD 13445 K0 -25 129 0.3492 .0269 86.1 HD 13435 K2 -37 41 undetermined undetermined 95 HD 14412 G5 -10 33 0.1545 .0025 97 Kappa Fornax G1 -13 35 0.0186 .0078 111 Tau 1 Eridani F6 14 81 0.0544 .0078 136 Zeta 1 Reticuli G2 15 79 0.2077 .0321 138 Zeta 2 Reticuli G1 -27 127 0.2075 .0340 139 82 Eridani G5 -12 37 0.3602 .0310 231 Alpha Mensae G5 -13 22 0.1156 .0065 Sun Sol G5 0 0 0.0559 .0091 All the stars listed here are main sequence or spectral group V stars. Tau Ceti has a slight peculiarity in its spectrum as explained in the text. W- velocity is the star’s motion in km/sec in a direction above or below (-) in the galactic plane. Total space velocity relative to the sun is also in km/sec. Data is from the Gliese Catalog of Nearby Stars (1969 edition). ============================================================================== Consider, for example, the velocities of these stars in space. It is now known that the composition and the age of a star shows a reasonably close correlation with that star’s galactic orbit. The understanding of this correlation demands a little knowledge of galactic structure. Our galaxy, as far as we are concerned, consists essentially of two parts — the halo, and the disk. Apparently when the galaxy first took shape about 10 billion years ago, it was a colossal sphere in which the first generation of stars emerged. These stars — those that remain today, anyway — define a spherical or halolike cloud around the disk shaped Milky Way galaxy. Early in the galaxy’s history, it is believed that the interstellar medium had a very low metal content because most of the heavy elements (astronomers call any element heavier than helium «heavy» or a «metal») are created in the cores of massive stars which then get released into the interstellar medium by stellar winds, novae and supernovae explosions. Few such massive stars had «died» to release their newly made heavy elements. Thus, the stars which formed early (called Population II stars) tend to have a spherical distribution about the center of the galaxy and are generally metal-poor. A further gravitational collapse occurred as the galaxy flattened out into a disk, and a new burst of star formation took place. Since this occurred later and generations of stars had been born and died to enrich the interstellar medium with heavy elements, these disk stars have a metal-rich composition compared to the halo stars. Being in the disk, these Population I stars (the sun, for example) tended to have motions around the galactic core in a limited plane — something like the planets of the solar system. Population II stars — with their halo distribution — usually have more random orbits which cut through the Population I hoards in the galactic plane. A star’s space velocity perpendicular to the galactic plane is called its W-velocity. Knowing the significance of the W-velocity, one can apply this information to find out about the population classification and hence the ages and compositions of stars in the solar neighborhood — the Fish-Hill stars in particular. High W-velocity suggests a Population II star, and we find that six of the 16 stars are so classified while the remaining majority are of Population I. A further subdivision can be made using the W-velocity data (the results are shown in the table below. ================================================================= POPULATION CLASSIFICATION OF THE FISH-HILL STARS OLD POPULATION I (1 TO 4 BILLION YEARS OLD) Gliese 59 Gliese 67 107 Piscium OLDER POPULATION I (4 TO 6 BILLION YEARS OLD) Tau 1 Eridani Tau Ceti Alpha Mensae Gliese 95 Kappa Fornax 54 Piscium Sun DISK POPULATION II (6 TO 8 BILLION YEARS OLD) Zeta 1 Reticuli Zeta 2 Reticuli INTERMEDIATE POPULATION II (ABOUT 10 BILLION YEARS OLD) Zeta Tucanae Gliese 86 Gliese 86.1 82 Eridani ================================================================== According to this classification system (based on one by A. Blaauw), most of the 16 stars are in the same class as the sun — implying that they are roughly of the same composition and age as the sun. The sun would seem to be a natural unit for use in comparing the chemical compositions and ages of the stars of the Fish-Hill pattern because it is, after all, the standard upon which we base our selection of stars capable of supporting life. Three stars (Gliese 59, 67 and 68) are known as Old Population I and are almost certainly younger than the sun. They also probably have a higher metal content than the sun, although specific data is not available. The Disk Population II stars are perhaps two to four billion years older than the sun, while the Intermediate Population II are believed to be a billion or two years older still. For main sequence stars like the sun, as all these stars are, it is generally believed that after the star is formed and settled on the main sequence no mixing between the outer layers and the thermo-nuclear core occurs. Thus the composition of the outer layers of a star, (from which we receive the star’s light) must have essentially the same composition as the interstellar medium out of which the star and its planets were formed. Terrestrial planets are composed primarily of heavy elements. The problem is: If there is a shortage of heavy elements in the primeval nebula, would terrestrial planets be able to form? At present, theories of planetary formation are unable to state for certain what the composition of the cloud must be in order for terrestrial planets to materialize, although it is agreed to be unlikely that Population II stars should have terrestrial planets. But for objects somewhere between Population I and II — especially Disk Population II — no one really knows. Although we can’t be certain of determining whether a star of intermediate metal deficiencies can have planets or not, we can make certain of the existence of metal deficiencies in those stars. The eccentricities and inclinations of the galactic orbits of the Fish-Hill stars provide the next step in the information sequence. The table above also shows that the stars Gliese 136, 138, 139, 86 and 71 have the highest eccentricities and inclinations in their galactic orbits. This further supports the Population II nature of these four stars. According to B.E.J. Pagel of the Royal Greenwich Observatory in England, the correlation between eccentricity and the metal/hydrogen ratio is better than that between the W-velocity and the metal/hydrogen ratio. It is interesting to see how closely the values of eccentricity seem to correspond with Population type as derived from W-velocity — Old Population I objects having the lowest values. Since the two methods give similar results, we can lend added weight to our classification. So far all the evidence for metal deficiencies has been suggestive; no direct evidence has been given. However, specific data can be obtained from spectroscopic analysis. The system for which the best set of data exists also happens to be one of the most important stars of the pattern, Zeta 1 Reticuli. In 1966, J.D. Danziger of Harvard University published results of work he had done on Zeta 1 Reticuli using wide-scan spectroscopy. He did indeed find metal deficiencies in the star: carbon, 0.2, compared to our sun; magnesium, 0.4; calcium, 0.5; titanium, 0.4; chromium, 0.3; manganese, 0.4; iron, 0.4; cobalt, 0.4; nickel, 0.2, and so on. In spite of the possible error range of about 25 percent, there is a consistent trend of metal deficiencies — with Zeta 1 Reticuli having less than half the heavy elements per unit mass that the sun does. Because Zeta 1 Reticuli has common proper motion and parallax with Zeta 2 Reticuli, it probably also has the same composition. Work done by M.E. Dixon of the University of Edinburgh showing the two stars to have virtually identical characteristics tends to support this. The evidence that the Zeta Reticuli system is metal deficient is definite. From this knowledge of metal deficiency and the velocities and eccentricities, we can safely conclude that the Zeta Reticuli system is older than the sun. The question of terrestrial planets being able to form remains open. The other two stars which have high velocities and eccentricities are 82 Eridani (Gliese 139) and Gliese 86. Because the velocities of these stars are higher than those of Zeta Reticuli, larger metal deficiencies might be expected. For the case of Gliese 86, no additional information is presently available. However, some theoretical work has been done on 82 Eridani concerning metal abundances by J. Hearnshaw of France’s Meudon Observatory. Although 82 Eridani is a high velocity star, its orbit lies largely within the galactic plane, and also within the solar orbit. Its orbit is characteristic of the Old Disk Population, and an ultraviolet excess indicates only a mild metal deficiency compared to the sun. Hearnshaw’s conclusions indicate that the metal deficiency does not appear to be any worse than that of the Zeta Reticuli pair. Because Gliese 86 has a velocity, eccentricity and inclination similar to 82 Eridani, it seems likely that its chemical composition may also not have severe metal deficiencies, but be similar to those of 82 Eridani. Tau Ceti appears to be very much like the sun except for slight deficiencies of most metals in rarely seen abnormal abundances of magnesium, titanium, silicon and calcium. Stars in this class are known as alpha-rich stars, but such properties do not appear to make Tau Ceti unlikely to have planets similar to the sun’s. Tau 1 Eridani, an F6V star, has a life expectancy of 4.5 billion years — so it cannot be older than the sun. The low eccentricities and low moderate velocity support an age and composition near that of the sun. Gliese 67 is a young star of at least solar metal abundances, considering its low velocity and eccentricity. Having covered most of the stars either directly or simply by classifying them among the different Population classes, it is apparent that there is a wide age range among different stars of this group as well as a range of compositions. It is curious that the stars connected by the alleged «trade routes» (solid lines) are the older and occasionally metal deficient ones — while the stars connected by dotted lines seem to be younger Population I objects. A final point concerning the metal deficiencies is rather disturbing. Even though terrestrial planets might form about either star in the Zeta Reticuli system, there is a specific deficiency in carbon to well within the error range. This is disturbing because carbon is the building block of organic molecule chains. There is no way of knowing whether life on Earth would have emerged and evolved as far as it has if carbon were not as common here. Another problem: If planets formed but lacked large quantities of useful industrial elements, could a technical civilization arise? If the essential elements were scarce or locked up in chemical compounds, then an advanced technology would be required to extract them. But the very shortage of these elements in the first place might prevent this technology from being realized. The dolphins are an example of an intelligent but nontechnical race. They do not have the means to develop technology. Perhaps some land creatures on another planet are in a comparable position by not having the essential elements for technological development. (This theme is explored in detail in «What Chariots of Which Gods?», August 1974.) This whole speculation certainly is not strong enough to rule out the Fish interpretation of the Hill map given our present state of knowledge. Actually in some respects, the metal deficiencies support the Fish hypothesis because they support an advanced age for several of the stars — suggesting that if cultures exist in these star systems, they might well be advanced over our own. The fact that none of the stars in the pattern is seriously metal deficient (especially the vital branch high velocity stars 82 Eridani and Gliese 86) is an encouragement to the Fish interpretation — if terrestrial planets can form in the first place and give rise to technical civilizations. Once again we are confronted with evidence which seems to raise as many questions as it answers. But the search for answers to such questions certainly can only advance knowledge of our cosmic environment. Jeffrey L. Kretsch is an astronomy student at Northwestern University working under the advisement of Dr. J. Allen Hynek. For more than a year Kretsch has been actively pursuing follow-up studies to the astronomical aspects of the Fish-Hill map. More of his studies and comment s appear in In Focus. ================================================================= COMMENTARY Editor’s Preface The lead article in the December 1974 issue of ASTRONOMY, entitled «The Zeta Reticuli Incident», centered on interpretation of a map allegedly seen inside an extraterrestrial spacecraft. The intent of the article was to expose to our readers a rare instance where astronomical techniques have been used to analyze a key element in a so-called «close encounter» UFO incident. While not claiming that the analysis of the map was proof of a visit by extraterrestrials, we feel the astronomical aspects of the case are sufficiently intriguing to warrant wide dissemination and further study. The following notes contain detailed follow-up commentary and information directly related to that article. ================================================================= PATTERN RECOGNITION & ZETA RETICULI By Carl Sagan & Steven Soter «The Zeta Reticuli Incident» is very provocative. It claims that a map, allegedly shown on board a landed extraterrestrial spacecraft to Betty Hill in 1961, later drawn by her from memory and published in 1966, corresponds well to similar maps of the closest stars resembling the sun based on stellar positions in the 1969 Gliese Catalog of Nearby Stars. The comparison maps were made by Marjorie Fish using a three dimensional physical model and later by a group of Ohio State University students using a presumably more accurate (i.e., less subjective) computer generated projection. The argument rests on how well the maps agree and on the statistical significance of the comparison. Figure 1 [not available here] show the Hill map and the Ohio State computer map with connecting lines as given in the ASTRONOMY article. The inclusion of these lines (said to represent trade or navigation routes) to establish a resemblance between the maps is what a lawyer would call «leading the witness». We could just as well have drawn lines as in the bottom of Figure 1 to lead the other way. A less biased comparison of the two data sets, without connecting lines as in Figure 2, shows little similarity. Any residual resemblance is enhanced by there being the same number of points in each map, and can be accounted for by the manner in which these points were selected. The computer star map includes the sun and 14 stars selected from a list of the 46 nearest stars similar to the sun, derived from the Gliese catalog. It is not clear what criteria were used to select precisely these 14 stars from the list, other than the desire to find a resemblance to the Hill map. However, we can always pick and choose from a large random data set some subset that resembles a preconceived pattern. If we are free also to select the vantage point (from all possible directions for viewing the projection of a three dimensional pattern), it is a simple matter to optimize the desired resemblance. Of course such a resemblance in the case of selection from a random set is a contrivance — an example of the statistical fallacy known as «the enumeration of favorable circumstances». The presence of such a fallacy in this case appears even more likely when we examine the original Hill drawing, published in The Interrupted Journey by John Fuller. In addition to the prominent points that Betty Hill connected by lines, her map also includes a number of apparently random dots scattered about — evidently to represent the presence of background stars but not meant to suggest actual positions. However, three of these dots appear in the version of the Hill map used in the comparison, while the others are absent. Thus some selection was made even from the original Hill map, although not to the same extent as from the Gliese catalog. This allow even greater freedom to contrive a resemblance. Finally, we lear from The Interrupted Journey that Betty Hill first thought she saw a remarkable similarity between her UFO star map and a map of the constellation Pegasus published in the New York Times in 1965 to show the position of the quasar CTA-102. How many star maps, derived from the Gliese catalog or elsewhere, have been compared with Betty Hill’s before a supposed agreement was found? If we suppress information on such comparisons we also overestimate the significance of the result. The argument on «The Zeta Reticuli Incident» demonstrates only that if we set out to find a pattern correlation between two nearly random data sets by selecting at will certain elements from each and ignoring others, we will always be successful. The argument cannot serve even to suggest a verification of the Hill story — which in any case is well known to be riddled with internal and external contradictions, and which is amenable to interpretations which do not invoke extraterrestrial intelligence. Those of us concerned with the possibility of extraterrestrial intelligence must take care to demand adequately rigorous standards of evidence. It is all too easy, as the old Chinese proverb says, for the imprisoned maiden to mistake the beating of her own heart for the hoof beats of her rescuer’s horse. Steven Soter is a research associate working under the advisement of Carl Sagan, director of Cornell University’s laboratory for Planetary Studies. ================================================================= REPLY: By Terence Dickinson The question raised by Steven Soter and Carl Sagan concerning the pattern resemblance of the Hill map and the computer generated projection of the Fish pattern stars is certainly a key question worthy of discussion. Next month two authors will make specific comments on this point. Briefly, there is more to discounting the Fish interpretation than pattern resemblance. We would have discounted the Fish interpretation immediately on pattern resemblance alone. The fact that all the connecting lines join stars in a logical distance progression, and that all the stars are solar type stars, is significant. Ms. Fish tried to fit hundreds of other viewpoints and this one was the only one that even marginally fit and made sense in three dimensions and contained solar type stars. in this context, you could not «have just as well drawn the lines…to lead the other way». Naturally there was a desire to find a resemblance between a group of nearby stars and the Hill pattern! That’s why Marjorie Fish built six models of the solar neighborhood containing the relative positions of up to 256 nearby stars. The fact that she came up with a pattern that fits as well as it does is a tribute to her perseverance and the accuracy of the models. Stars cannot be moved around «to optimize the desired resemblance». Indeed Marjorie Fish first tried models using nearby stars of other than strictly solar type as defined in the article. She found no resemblances. The three triangle dots selected from the background dots in the Hill map were selected because Mrs. Hill said they were more prominent than the other background stars. Such testimony was the basis of the original map so we either accept Mrs. Hill’s observations and attempt to analyze them or reject the whole incident. We feel there is sufficient evidence compelling us not to reject the whole incident at this time. We too are demanding rigorous standards of evidence to establish the reality of extraterrestrial intelligence. If there is even the slightest possibility that the Hills’ encounter can provide information about such life, we feel it is worth pursuing. The map is worthy of examination by as many critical minds as possible. ================================================================= REPLY: By David R. Saunders Last month, Steven Soter and Carl Sagan offered two counterarguments relating to Terence Dickinson’s article, «The Zeta Reticuli Incident» (ASTRONOMY, December 1974). Their first argument was to observe that the inclusion of connecting lines in certain maps «is what a lawyer would call ‘leading the witness’.» This was used as the minor premise in a syllogism for which the major premise was never stated. Whether we should consider «leading the witness» a sin or not will depend on how we conceive the purpose of the original article. The implied analogy between ASTRONOMY magazine and a court of law is tenuous at best; an expository article written for a nonprofessional audience is entitled, in my opinion, to do all it can to facilitate communication — assuming that the underlying message is honest. Much of what we call formal education is really little more than «leading the witness», and no one who accepts the educational goals objects very strongly to this process. In this context, we may also observe that Soter’s and Sagan’s first argument provides another illustrative example of «leading the witness»; the argument attacks procedure, not substance — and serves only to blunt the reader’s possible criticism of the forthcoming second argument. This paragraph may also be construed as an effort to lead the witness. Once we have been sensitized to the possibilities, none of us needs to be further misled! The second argument offered by Soter and Sagan does attack a substance. Indeed, the editorial decision to publish the original article was a responsible decision only if the issues raised by this second line of possible argument were fully considered. Whenever a statistical inference is made from selected data, it is crucial to determine the strenuousness of that selection and then to appropriately discount the apparent clarity of the inference. By raising the issue of the possible effects of selection, Soter and Sagan are right on target. However, by failing to treat the matter with quantitative objectivity ( by failing to weigh the evidence in each direction numerically, for example), they might easily perform a net disservice. In some situations, the weight of the appropriate discount will suffice to cancel the clarity of a proposed inference — and we will properly dismiss the proposal as a mere capitalization on chance, or a lucky outcome. (It is abundantly clear that Soter and Sagan regard the star map results as just such a fortuitous outcome.) In some other situations, the weight of the appropriate discount may be fully applied without accounting for the clarity of the inference as a potentially valid discovery. For example, if I proposed to infer from four consecutive coin tosses observed as heads that the coin would always yield heads, you would properly dismiss this proposal as unwarranted by the data. However, if I proposed exactly the same inference based on 40 similar consecutive observations of heads, you would almost certainly accept the inference and begin looking with me for a more systematic explanation of the data. The crucial difference here is the purely quantitative distinction between 4 and 40; the two situations are otherwise identical and cannot be distinguished by any purely qualitative argument. When Soter and Sagan use phrases such as «some subset that resembles», «free also to select the vantage point», «simple matter to optimize», and «freedom to contrive a resemblance», they are speaking qualitatively about matters that should (and can) be treated quantitatively. Being based only on this level of argument, Soter’s and Sagan’s conclusions can only be regarded as inconclusive. A complete quantitative examination of this problem will require the numerical estimation of at least three factors, and their expression in a uniform metric so that wee can see which way the weight of the evidence is leaning. The most convenient common metric will be that of «bits of information», which is equivalent to counting consecutive heads in the previous example. One key factor is the degree of resemblance between the Hill map and the optimally similar computer-drawn map. Precisely how many consecutive heads is this resemblance equivalent to? A second key factor is the precise size of the population of stars from which the computer was allowed to make its selection. And a third key factor is the precise dimensionality of the space in which the computer was free to choose the best vantage point. If the first factor exceeds the sum of the other two by a sufficient margin, we are justified in insisting on a systematic explanation for the data. The third factor is the easiest to deal with. The dimensionality of the vantage-point space is not more than three. A property of the metric system for weighing evidence is that each independent dimension of freedom leads us to expect the equivalent of one more consecutive head in the observed data. Three dimensions of freedom are worth exactly 3.0 bits. In the end, even three bits will be seen as relatively minor. The second factor might be much larger than this, and deserve relatively more discussion. The appropriate discount for this selection will be log2C, where C is the number of distinct combinations of stars «available» to the computer. If we were to agree that C must represent the possible combinations of 46 stars taken 14 at a time, then log2C would be 37.8 bits; this would be far more than enough to kill the proposed inference. However, not all these combinations are equally plausible. We really should consider only combinations that are adjacent to one another and to the sun, but it is awkward to try to specify exactly which combinations these are. The really exciting moment in working with these data came with the realization that in the real universe, our sun belongs to a closed cluster together with just six of the other admissible stars — Tau Ceti, 82 Eridani, Zeta Tucanae, Alpha Mensae, and Zeta 1 and Zeta 2 Reticuli. The real configuration of interstellar distances is such that an explorer starting from any of the seven should visit all of them before venturing outside. If the Hill map is assumed to include the sun, then it should include the other members of this cluster within an unbroken network of connections, and the other connected stars should be relatively adjacent in the real universe. Zeta Reticuli occupies a central position in all of the relatively few combinations that now remain plausible. However, in my opinion, the adjacency criteria do leave some remnant ambiguity concerning the combination of real stars to be matched against the Hill map — but only with respect to the region farthest from the sun. The stars in the closed cluster and those in the chain leading to Gliese 67 must be included, as well as Gliese 86 and two others from a set of five candidates. Log2C for this remnant selection is 3.9 bits. we must also notice that the constraint that Zeta Tucanae be occulted by Zeta Reticuli reduces the dimensionality of the vantage-point space from 3.0 to 1.0. Thus, the sum of factors two and three is now estimated as only 4.9 bits. The first factor is also awkward to evaluate — simply because there is no standard statistical technique for comparing points on two maps. Using an approximation based on rank-order correlation, I’ve guessed that the number we seek here is between 11 and 16. (This is the result cited by Dickinson on page 15 of the original article.) Deducting the second and third factors, this rough analysis leaves us with an empirical result whose net meaning is equivalent to observing at least 6 to 11 consecutive heads. (I say «at least», because there are other factors contributing to the total picture — not discussed either by Dickinson or by Soter and Sagan — that could be adduced to enhance this figure. For example, the computed vantage point is in good agreement with Betty Hill’s reported position when observing the map, and the coordinate system implicit in the boundaries of the map is in good agreement with a natural galactic coordinate system. Neither have we discussed any quantitative use of the connections drawn on the Hill map, which were put there in advance of any of these analyses.) In the final interpretation, it will always be possible to argue that 5 or 10 or even 15 bits of remarkable information simply isn’t enough. However, this is a matter for each of us to decide independently. In deciding this matter, it is more important that we be consistent with ourselves (as we review a large number of uncertain interpretations of data that we have made) than that we be in agreement with some external authority. I do believe, though, that relatively few individuals will continue a coin-tossing match in which their total experience is equivalent to even six consecutive losses. In scientific matters, my own standard is that I’m interested in any result that has five or more bits of information supporting it — though I prefer not to stick my neck out publicly on the basis of less than 10. Adhering to this standard, I continue to find the star map results exceedingly interesting. Dr. David R. Saunders is a Research Associate at the University of Chicago’s Industrial Relations Center. ================================================================= REPLY: By Michael Peck Carl Sagan and Steven Soter, in challenging the possibilities discussed in «The Zeta Reticuli Incident», suggest that without the connecting lines drawn into the Hill map and the Fish interpretation there is little resemblance between the two. This statement can be tested using only X and Y coordinates of the points in the Hill map and a projection of the stars in the Fish pattern. The method used for the comparison can be visualized this way: Suppose points of the Hill map and the Fish map are plotted on separate glass plates. These plates are held parallel (one behind the other), and are moved back and forth and rotated until the patterns appear as nearly as possible to match. A systematic way of comparing the patterns would be to adjust the plates until corresponding pairs of points match exactly. Then the other points in the patterns can be compared. Repeating this process for all the possible pairs of points (there are 105 in this case), the best fit can be found. Mathematically, this involves a change of scale and a simple coordinate transformation. A computer program was written which, using X and Y coordinates measured from a copy of the Hill map and a projection of the Fish stars, and using the Hill map as the standard, computed new X and Y coordinates for the Fish stars using the process described. From these two sets of coordinates, six quantities were calculated: the average difference in X and Y; the standard deviation of the differences in X and Y, a measure of the amount of variation of the differences; and correlation coefficients in X and Y. The coefficient of correlation is a quantity used by statisticians to test a suspected relation between two sets of data. In this case, for instance, we suspect that the X and Y coordinates computed from the Fish map should equal the X and Y coordinates of the Hill map. If they matched exactly, the correlation coefficients would be one. If there were no correlation at all, the value would be near zero. We found that, for the best fitting orientation of the Fish stars, there was a correlation coefficient in X of 0.95 and in Y of 0.91. In addition, the average difference and the standard deviation of the differences were both small — about 1/10 the total range in X and Y. As a comparison, the same program was run for a set of random points, with resulting correlation coefficients of 1/10 or less (as was expected). We can conclude, therefore, that the degree of resemblance between the two maps is fairly high. From another point of view, it is possible to compute the probability that a random set of points will coincide with the Hill map to the degree of accuracy observed here. The probability that 15 points chosen at random will fall on the points of the Hill map within an error range which would make them as close as the Fish map is about one chance in 10 to the fifteenth power (one million billion). It is 1,000 times more probable that a person could predict a bridge hand dealt from a fair deck. Michael Peck is an astronomy student at Northwestern University in Illinois. ================================================================= REBUTTAL: To David Saunders and Michael Peck By Carl Sagan and Steven Soter Dr. David Saunders last month claimed to have demonstrated the statistical significance of the Hill map, which was allegedly found on board a landed UFO and supposedly depicted the sun and 14 nearby sunlike stars. The Hill map was said to resemble the Fish map — the latter being an optimal two-dimensional projection of a three-dimensional model prepared by selecting 14 stars from a positional list of the 46 nearest known sunlike stars. Saunders’ argument can be expressed by the equation SS = Dr -(SF + VP), in which all quantities are in information bits. SS is the statistical significance of the correlation between the two maps, DR is the degree of resemblance between them, SF is a selection factor depending on the number of stars chosen and the size of the list, and VP is the information content provided by a free choice in three dimensions of the vantage point for projecting the map. Saunders finds SS = 6 to 11 bits, meaning that the correlation is equivalent to between 6 and 11 consecutive heads in a coin toss and therefore probably not accidental. The procedure is acceptable in principle, but the result depends entirely on how the quantities on the right-hand side of the equation were chosen. For the degree of resemblance between the two maps, Saunders claims that DR = 11 to 16 bits, which he admits is only a guess — but we will let it stand. For the selection factor, he at first takes SF = log2C = 37.8 bits, where C represents the combinations of 46 things taken 14 at a time. Realizing that the size of this factor alone will cause SS to be negative and wipe out his argument, he makes a number of ad hoc adjustments based essentially on his interpretation of the internal logic of the Hill map, and SF somehow gets reduced to only 3.9 bits. For the present, we will let even that stand in order to avoid becoming embroiled in a discussion of how an explorer from the star Zeta Reticuli would choose to arrange his/her/its travel itinerary — a matter about which we can claim no particular knowledge. However, we must bear in mind that a truly unprejudiced examination of the data with no a priori interpretations would give SF = 37.8 bits. It is Saunders’ choice of the vantage point factor VP with which we must take strongest issue, for this is a matter of geometry and simple pattern recognition. Saunders assumes that free choice of the vantage point for viewing a three-dimensional model of 15 stars is worth only VP = 3 bits. He then reduces the information content of directionality to one bit by introducing the «constraint» that the star Zeta Tucanae be occulted by Zeta Reticuli (with no special notation on the Hill map to mark this peculiarity). This ad hoc device is invoked to explain the absence of Zeta Tucanae from the Hill map, but it reveals the circular reasoning involved. After all, why bother to calculate the statistical significance of the supposed map correlation if one has already decided which points represent which stars? Certainly the selection of vantage point is worth more than three bits (not to mention one bit). Probably the easiest circumstance to recognize and remember about random projections of the model in question are the cases in which two stars appear to be immediately adjacent. By viewing the model from all possible directions, there are 14 distinct ways in which any given star can be seen in projection as adjacent to some other star. This can be done for each of the 15 stars, giving 210 projected configurations — each of which would be recognized as substantially different from the others in information content. And of course there are many additional distinct recognizable projections of the 15 stars not involving any two being immediately adjacent. (For example, three stars nearly equidistant in a straight line are easily recognized, as in Orion’s belt.) Thus for a very conservative lower bound, the information content determined by choice of vantage point (that is, by being allowed to rotate the model about three axes) can be taken as at least equal to VP = log2(210) = 7.7 bits. Using the rest of Saunders’ analysis, this would at best yield SS = zero to 4.4 bits — not a very impressive correlation. There is another way to understand the large number of bits involved in the choice of the vantage point. The stars in question are separated by distances of order 10 parsecs. If the vantage point is situated above or not too far from the 15 stars, it need only be shifted by about 0.17 parsecs to cause a change of one degree in the angle subtended by some pair of stars. Now one degree is a very modest resolution, corresponding to twice the full moon and is easily detected by anyone. For three degrees of freedom, the number of vantage points corresponding to this resolution is of order (10/0.17) cubed ~ (60) cubed ~ 2 X 10 to the fifth power, corresponding to VP = 17.6 bits. This factor alone is sufficient to make SS negative, and to wipe out any validity to the supposed correlation. Even if we were to accept Saunders’ claim that SS = 6 to 11 bits (which we obviously do not, particularly in view of the proper value for SF), it is not at all clear that this would be statistically significant because we are not told how many other possible correlations were tried and failed before the Fish map was devised. For comparison, there is the well-known correlation between the incidence of Andean earthquakes and oppositions of the planet Uranus. It is unlikely in the extreme that there is a physical causal mechanism operating here — among other reasons, because there is no correlation with oppositions of Jupiter, Saturn or Neptune. But to have found such a correlation the investigator must have sought a wide variety of correlations of seismic events in many parts of the world with oppositions and conjunctions of many astronomical objects. If enough correlations are sought, statistics requires that eventually one will be found, valid to any level of significance that we wish. Before we can determine whether a claimed correlation implies a causal connection, we must convince ourselves that the number of correlations sought has not been so large as to make the claimed correlation meaningless. This point can be further illustrated by Saunders’ example of flipping coins. Suppose we flip a coin once per second for several hours. Now let us consider three cases: two heads in a row, 10 heads in a row, and 40 heads in a row. We would, of course, think there is nothing extraordinary about the first case. Only four attempts at flipping two coins are required to have a reasonable expectation value of two heads in a row. Ten heads in a row, however, will occur only once in every 2 to the tenth power = 1,024 trials, and 40 heads in a row will occur only once every 2 to the fortieth ~ 10 to the twelfth power trials. At a flip rate of one coin per second, a toss of 10 coins requires 10 seconds; 1,024 trials of 10 coins each requires just under three hours. But 40 heads in a row at the same rate requires 4 X 10 to the thirteenth power seconds or a little over a million years. A run of 40 consecutive heads in a few hours of coin tossing would certainly be strong prima facie evidence of the ability to control the fall of the coin. Ten heads in a row under the circumstances we have described would provide no convincing evidence at all. It is expected by the law of probability. The Hill map correlation is at best claimed by Saunders to be in the category of 10 heads in a row, but with no clear statement as to the number of unsuccessful trials previously attempted. Michael Peck finds a high degree of correlation between the Hill map and the Fish map, and thereby also misses the central point of our original criticism: that the stars in the Fish map were already preselected in order to maximize that very correlation. Peck finds one chance in 10 to the fifteenth power that 15 random points will correlate with the Fish map as well as the Hill map does. However, had he selected 15 out of a random sample of, say, 46 points in space, and had he simultaneously selected the optimal vantage point in three dimensions in order to maximize the resemblance, he could have achieved an apparent correlation comparable to that which he claims between the Hill and Fish maps. Indeed, the statistical fallacy involved in «the enumeration of favorable circumstances» leads necessarily to large, but spurious correlations. We again conclude that the Zeta Reticuli argument and the entire Hill story do not survive critical scrutiny. Dr. Steven Soter is a research associate in astronomy and Dr. Carl Sagan is director of the Laboratory for Planetary Studies, both at Cornell University in Ithaca, N.Y. ================================================================= IS THE FISH INTERPRETATION UNIQUE? By Robert Sheaffer The story of Marjorie Fish’s attempts at identifying the star patterns sketched by Betty Hill was told in «The Zeta Reticuli Incident» by Terence Dickinson in the December 1974 issue. This pattern of solar type stars unquestionably bears a striking resemblance to the map that Betty Hill says she saw while she was being examined aboard a flying saucer. But how significant is this resemblance? Is there only one pattern of stars which will match the sketch convincingly? Betty Hill herself discovered an impressive resemblance in a star map published in the New York Times. In 1965 a map of the stars of the constellation Pegasus appeared in that newspaper, accompanying the announcement by a Russian radio astronomer (Comrade Sholomitsky) the radio source CTA-102, depicted in the map, may be sending out intelligent radio signals. Intrigued by this remarkable claim, Betty Hill studied the map, and added the corresponding star names to her sketch. As you can see, the Pegasus map — while not exactly like the sketch — is impressively similar. If CTA-102 — appearing near the «globes» in her sketch — was in reality an artificial radio source, that would give the Pegasus map much additional credibility. However, the case for the artificial origin of quasar CTA- 102 soon fell flat. Other scientists were unable to observe these reported strange variations which had caused Sholomitsky to suggest that CTA-102 might be pulsing intelligently. In 1966, when Marjorie Fish was just beginning her work, Charles W. Atterberg (employed by an aeronautical communications firm in Illinois) also set out to attempt to identify this star pattern. «I began my search by perusing a star atlas I had on hand,» Atterberg explained. «I soon realized that this was a pointless and futile project.» Any star pattern useful for interstellar navigation, he reasoned, would not be Earth-centered as are the familiar constellation figures. Thus Atterberg began to look in three dimensions for a pattern of stars that would approximate the Hill sketch. Working from a list of the nearest stars, Atterberg «began plotting these stars as they would be seen from various directions. I did this by drawing the celestial position of a star, I would draw a straight line penetrating the sphere at a known position, and measure out to the distance of the star…It at first took me hours to plot this out from any one particular direction.» When plotting the stars as seen from a position indefinitely far away on the celestial equator at 17 hours right ascension, Atterberg found a pattern of stars conspicuously similar to the Hill sketch. After much work he refined this position to 17 hours 30 minutes right ascension, -10 degrees declination. The resulting map resembles the Hill sketch even more strongly than does the Fish map, and it contains a greater number of stars. Furthermore, all of the stars depicted in the Atterberg map lie within 18.2 light-years of the sun. The Fish map reaches out 53 light-years, where our knowledge of stellar distances is much less certain. Carl Sagan states in Intelligent Life in the Universe that, excluding multiple star systems, «the three nearest stars of potential biological interest are Epsilon Eridani, Epsilon Indi and Tau Ceti.» These three stars from the heart of the Atterberg map, defining the two spheres in the very center of the heavy lines that supposedly represent the major «trade routes» of the «UFOnauts». Epsilon Eridani and Tau Ceti were the two stars listened to by Project Ozma, the pioneering radio search for intelligent civilization in space. Other heavy lines connect the spheres with the sun, which we know has at least one habitable planet. Thinner lines, supposedly representing places visited less frequently, connect with Groombridge 1618, Groombridge 34, 61 Cygni and Sigma Draconis, which are designated as stars «that could have habitable planets» in Stephen H. Dole’s Rand Corporation study, Habitable Planets for Man. Of the 11 stars (not counting the sun) that have allegedly been visited by the aliens, seven of them appear on Dole’s list. Three of the four stars which are not included are stopping points on the trip to Sigma Draconis, which Dole considered to have even better prospects than Epsilon Eridani or Epsilon Indi for harboring a habitable planet. Another remarkable aspect of the Atterberg map is the fact that its orientation, unlike the Fish map, is not purely arbitrary. Gould’s belt — a concentration of the sky’s brightest stars — is exactly perpendicular to the plane of the Atterberg map. Furthermore, it is vertical in orientation; it does not cut obliquely across the map, but runs exactly up and down. A third curious coincidence: The southpole of the Atterberg map points toward the brightest part of Gould’s belt, in the constellation Carina. The bright stars comprising Gould’s belt might well serve as a useful reference frame for interstellar travelers, and it is quite plausible that they might base a navigational coordinate system upon it. No other map interpreting the Hill sketch offers any rationale for its choice of perspectives. The problem with trying to interpret Betty Hill’s sketch is that it simply fits too many star patterns. Three such patterns have been documented to date. How many more exist undiscovered? Robert Sheaffer is a computer systems programmer currently working at NASA’s Goddard Space Flight Center in Greenbelt, MD. ================================================================= REPLY: By Marjorie Fish Basically, Robert Sheaffer’s contention is that at least three patterns can be found that are similar to Betty Hill’s map, and therefore, more such interpretations are likely. If one stipulates that any stars from any vantage point can be used, then I agree that many patterns can be found similar to the map. However, if one uses restrictions on the type of stars, according to their probability of having planets and also on the logic of the apparent travel paths, then it is much more difficult. The three maps were: (1) Betty Hill’s interpretation of the constellation Pegasus as being similar to her map, (2) Charles Atterberg’s work, and (3) my work. When I started the search, I made a number of restrictions including: 1) The sun had to be part of the pattern with a line connected to it, since the leader of the aliens indicated this to Betty. 2) Since they came to our solar system, they should also be interested in solar type stars (single main sequence G, probably also late single main sequence F and early single main sequence K). These stars should not be bypassed if they are in the same general volume of space. 3) Since there are a number of the above stars relatively near the sun and the pattern shows only 12 stars, the pattern would have to be relatively close to us (or else they would be bypassing sunlike stars, which is illogical). 4) The travel pattern itself should be logical. That is, they would not zip out 300 light-years, back to 10 light-years, then out 1,000, etc. The moves should make a logical progression. 5) Large young main sequence stars (O, B, A, early F) which are unlikely to have planets and/or life would not be likely to be visited. 6) Stars off the main sequence with the possible exception of those just starting off the main sequence would probably be avoided as they are unsuitable for life and, due to their variability, could be dangerous. 7) If they go to one star of a given type, it shows interest in that type star — so they should go to other stars of that type if they are in the same volume of space. An exception to this might be the closest stars to the base star, which they might investigate out of curiosity in the early stages of stellar travel. For example, they would not be likely to bypass five red dwarfs to stop at the sixth, if all six were approximately equal in size, spectra, singleness or multiplicity, etc. Or, if they go to one close G double, they would probably go to other close G doubles. 8) The base star or stars is one or both of the large circles with the lines radiating from it. 9) One or both of the base stars should be suitable for life — F8 to K5 using the lowest limits given by exobiologists, or more likely, K1 given by Dole. 10) Because the base stars are represented as such large circles, they are either intrinsically bigger or brighter than the rest or they are closer to the map’s surface (the viewer) than the rest — probably the latter. This was later confirmed by Betty Hill. Mrs. Hill’s interpretation of Pegasus disregards all of these criteria. Atterberg’s work is well done. His positioning of the stars is accurate. He complies with criteria 1, 2, 3, 5, 6 and 8; fairly well with 4; less well with 9, and breaks down on 7 and 10. I will discuss the last three of Atterberg’s differences with my basic criteria in the following paragraphs: Relative to point 9, his base stars are Epsilon Indi and Epsilon Eridani, both of which are near the lower limit for life bearing planets — according to most exobiologists — and not nearly as suitable as Zeta 1 and 2 Reticuli. Concerning point 7, I had ruled out the red dwarfs fairly early because there were so many of them and there were only 12 lined points on the Hill map. If one used red dwarfs in logical consecutive order, all the lines were used up before the sun was reached. Atterberg used red dwarfs for some of his points to make the map resemble Betty Hill’s but he bypassed equally good similar red dwarfs to reach them. If they were interested in red dwarfs, there should have been lines going to Gliese 65 (Luyten 76208) which lies near Tau Ceti and about the same distance from Epsilon Eridani as Tau Ceti, and Gliese 866 (Luyten 789-6) which is closer to Tau Ceti than the sun. Gliese 1 (CD-37 15492) and Gliese 887 (CD-36 15693) are relatively close to Epsilon Indi. These should have been explored first before red dwarfs farther away. Red dwarfs Gliese 406 (Wolf 359) and Gliese 411 (BD + 36 2147) were by passed to reach Groombridge 1618 and Ross 128 from the sun. Barnard’s star would be the most logical first stop out from the sun, if one were to stop at red dwarfs, as it is the closest single M and is known to have planets. Since Atterberg’s pattern stars include a number of relatively close doubles (61 Cygni, Struve 2398, Groombridge 34 and Kruger 60), there should also be a line to Alpha Centauri — but there is not. Relating to point 10, Atterberg’s base stars are not the largest or brightest of his pattern stars. The sun, Tau Ceti, and Sigma Draconis are brighter. Nor are they closer to the viewer. The sun and 61 Cygni are much closer to the viewer than Epsilon Eridani. The whole orientation feels wrong because the base stars are away from the viewer and movement is along the lines toward the viewer. (Betty Hill told me that she tried to show the size and depth of the stars by the relative size of the circles she drew. This and the fact that the map was alleged to be 3-D did not come out in Interrupted Journey, so Atterberg would not have known that.) Sheaffer notes that seven of Atterberg’s pattern stars appear on Dole’s list as stars that could have habitable planets. These stars are Groombridge 1618 (Gliese 380, BD + 50 1725), Groombridge 34 (Gliese 15,BD +43 44), 61 Cygni, Sigma Draconis, Tau Ceti, Epsilon Eridani and Epsilon Indi. Of these seven, only Epsilon Eridani, Tau Ceti and Sigma Draconis are above Doles’ absolute magnitude minimum. The others are listed in a table in his book Habitable Planets for Man, but with the designation: «Probability of habitable planet very small; less than 0.001.» Epsilon Eridani was discussed earlier. Sigma Draconis appears good but is listed as a probable variable in Dorrit Hoffleit’s Catalogue of Bright Stars. Variability great enough to be noticed from Earth at Sigma Draconis’ distance would cause problems for life on its planets. This leaves Tau Ceti which is one of my pattern stars also. Another point Sheaffer made was that orientation of my map was arbitrary compared to Atterberg’s map’s orientation with Gould’s belt. One of my first questions to Betty Hill was, «Did any bright band or concentration of stars show?» This would establish the galactic plane and the map’s orientation, as well as indicate it was not just a local map. But there was none indicating that if the map was valid it was probably just a local one. The plane of the face of my model map is not random, as Sheaffer indicated. It has intrinsic value for the viewer since many of the pattern stars form a plane at this viewing angle. The value to the viewer is that these stars have their widest viewing separation at that angle, and their relative distances are much more easily comprehended. My final interpretation of the map was the only one I could find where all the restrictions outlined above were met. The fact that only stars most suitable for Earthlike planets remained and filled the pattern seems significant. Marjorie Fish is a research assistant at Oak Ridge National Laboratory in Tennessee. ================================================================= ZETA RETICULI — A RARE SYSTEM By Jeffrey L. Kretsch Zeta Reticuli is a unique system in the solar neighborhood — a wide physically associated pair of stars almost exactly like the sun. After searching through a list of stars selected from the Gliese catalog on the basis of life criteria, only one other pair within a separation of even 0.3 light-years could be found. (This pair — Gliese 201 and Gliese 202, a K5e and F8Ve pair separated by 0.15 light-years — is currently being investigated.) Zeta Reticuli is indeed a rare case. Based on the Fish interpretation of the Hill map, the Zeta Reticuli pair forms the base of the pattern. If the other stars in the patter fit, it is a remarkable association with a rare star system. In order to deal with this problem, I decided to computer the three-dimensional positions of the stars and construct a three-dimensional model showing these stars positions. Speaking quantitatively, I discovered the two patterns are certainly not an exact match. However, if one considers the question of match from the standpoint of how the Hill pattern was made as opposed to the derived pattern’s means of reproduction, the quantitative data may not be a complete means of determining whether the two patterns «match» or not. For example, the Hill pattern was drawn freehand — so one would have to determine how much allowance one must give for differences in quantitative data. In such areas, I am not qualified to give an opinion. However, because the map was drawn freehand from memory, the fact that the resemblance between the Fish map and the Hill map is a striking one should be considered. In my work I was able to verify the findings of Marjorie Fish in terms of the astronomy used. Jeffrey L. Kretsch is an astronomy student at Northwestern University. ================================================================= ZETARETI.UFO
MUFON _____________________________ UFO SYMPOSIUM -1974
“JOURNEY INTO THE HILL STAR MAP”
presented by
MARJORIE E. FISH
I became interested in UFO’s after reading Jacques Vallee’s Anatomy of a Phenomenon late in 1966. Previously, Interrupted Journey had been read in the Post, but I didn’t take it seriously, as I did not know about the many worldwide humanoid encounters. Once my interest was aroused, I remembered the star map (supposedly shown to Betty Hill by a UFOnaut). Here was something that could be checked. Either it represented a real set of stars which might be found and tell us something about the UFOnaut, or it might be remembered too poorly to help, or was totally fictitious. Even if a similar set of stars were found, it might be coincidental. But, unlike most UFO reports, the possibilities could be examined and the data re-checked.
Two years passed before I finally found a source for the data needed to build the models. During that time, everything available pertaining to astronomy, exo-biology, and hypnosis was eagerly devoured. Several methods for building the models were explored. Connie Lowien, now Mrs. Jeff Limpert, my niece, added several good ideas on format.
The data for the 10 parsec model was obtained in August, 1968; the data correlation begun; and the 10 parsec model completed in December, 1968. Most of the pattern was found in June and July of 1969. Betty Hill was contacted, then visited in August. Gliese’s 1969 Near Star Catalog came out in December, and the stars rechecked, but the last three stars were still elusive.
During the summer of 1972, I made a catalog of all the stars in the Gliese Catalog that might have terrestrial planets with native life. The stars were coded according to probability. Then new models were made using these stars, and in the fall of 1972, the last three stars with lines and the triangle stars were found; and work on the outer dimensions of the space represented by the map started. This was narrowed down within one light year in December. Work on all the stars in the map was tentatively concluded in February, 1973.
EXOBIOLOGICAL CONSIDERATIONS
To understand which stars could have planets with life, it is necessary to get an over-all view of types of stars and their special properties, and the conditions that would allow life to arise.
Necessity for Stable Heat Conditions. For life to begin (at least terrestrial life as we know it), the star must give off steady heat with very little fluctuation. Chemical processes that make up life require long molecular chains that can build up and break down easily. If the temperature is too hot, the chains break up but don’t rebuild. If the temperature is too cold, the chains are too stable and metabolism does not take place. A liquid (or possibly dense gas) would be best for the chemical reactions to take place. Liquids stay liquid within a relatively narrow temperature/pressure range, again requiring relatively stable heat. If there is too great a fluctuation, life that might have started cannot get established to the point where it can reproduce. Once life is firmly established, some forms can mutate to compensate for conditions at either temperature extreme of a stable environment to fill all the niches in an environment, but this is a relatively long process.
Life Cycle of a Typical Star and Stable Heat. When the star is on the main sequence, its hydrogen burning phase, it is burning at its steadiest for the longest period of its existence.
Before a star joins the main sequence, it is thought to be larger, less dense, with a cooler surface, so a color more on the red side of the spectrum than it will have on the main sequence, and variable: contracting because of gravitation, heating up because of the contraction, and expanding again. Once it heats to the point of hydrogen nuclear reactions, it steadies and joins the main sequence. As the hydrogen is used up, the star’s atmosphere is thought to expand. The color moves more to the red side of the spectrum again and the star becomes variable, expanding and contracting. The variation of heat, and the expanding envelope of the star’s atmosphere would destroy life on its planets. If the star is massive enough, later in this process, the star novas and matter is thrown off. The core of the star that remains is a white dwarf which gradually cools and darkens.
Life as we know it would only exist, native to a star system, when the star is on the main sequence, or possibly in the very beginning of the subgiant stage, and only if the star stays on the main sequence long enough for life to form.
Kinds of Stars on the Main Sequence, and Their Relation to Life. There are 7 main spectra groups of main sequence stars. These are, going from the most massive to the least massive, from the hottest to the coolest, from bluish to red: OV, BV, AV, FV, GV, KV, MV. Each of these groups is divided into 10 subgroups of descending size. Thus B9V is closer in size and characteristics to AOV than to BOV. Theoretically there are 70 subgroups within these 7 groups but not all of these are used regularly.
Star types 0, B, A and down to F2 are massive hot stars. Gravity forces the atoms closer together so atomic reactions take place at a faster rate than on smaller stars. So, although they have more matter, they burn faster, and last for a shorter period on the main sequence, not long enough for life to form if it takes as long as it did on Earth. Almost all of these stars are rotating fast, indicating that they probably do not have planets. There is very little chance for planets with life around these stars.
F2V to F5V could support planets with the beginnings of life but not all of these stars are rotating slowly so probably many do not have planets. In an F2 system, life might just be forming as the star starts to leave the main sequence.
F5V to F7V have more stars rotating slowly indicating the possibility of planets.
From approximately F8 on, all main sequence stars are rotating slowly, probably indicating planets. According to Carl Sagan, F8 is the point where intelligent life would have time to emerge. So main sequence stars from F8 through the Gs, to the early Ks have a possibility for life, including intelligent life.
Many exobiologists place the break-off point for life in the early Ks, usually K2. A few extend it to KS. Stars get progressively cooler. With late Ks and Ms the stars are so cool a planet would need to be very near the star’s surface to get enough heat for life processes. This raises problems of synchronous rotation, but one of the biggest problems is solar flaring. Apparently tiny stars have the same kinds of solar flares as stars like the sun. On the sun a solar flare changes the over-all output of energy very little, as there is so much total radiating surface besides the flare. On a small star, the same size flare may give off many times the star’s usual energy, destroying any life that might be on a nearby planet.
To summarize, the best chance for life is F8, all Gs, through KO, especially where the KO and G8 groups overlap. There is a possibility for terrestrial life and/or colonization around F5 to F7 stars, and much more remotely F2 to F5. There is some chance for life in K1 and K2 systems, and possibly, in special cases K2 to K5, but little around stars smaller than K5.
Single Stars Versus Multiple Stars and Terrestrial Planets with Life. Double and other multiple stars present many problems that may prevent the origin of life. Dr. Kuiper worked out an extensive theory in 1956 that multiple stars do not have planets. Even if this is not correct, life formation requires stable heat. Stable heat requires a stable orbit. Stable orbits are difficult to maintain in multiple systems due to multiple and variable gravitational pulls. There is also the possibility that multiple stars may affect each other’s time on the main sequence, shortening the time, so life would have less chance to form.
Single stars are much more likely to have planets with life, and possibly ONLY single stars have planets. The pattern, like Betty’s, is made up only of single stars.
Variability and the Main Sequence. The main sequence is the one point in a star’s existence when it is the least variable. However, I found that 1/3 of the single, main sequence stars in the best range for life in a 10 parsec radius of Earth were probably variable, although I could find no reason why the percentage is so high. The ratio dropped to 1/20 in the 10 to 20 parsec range, so we probably are not catching the variability in these stars. If the star is variable, chance for life is very small.
Summary of Exobiological Considerations. Single main sequence stars F8, G, to KO non-variable stars have the best chance for planets with life, including intelligent life. Similar stars F5 to F7 and K1 and K2 might support systems with life. F5 to F7 might be especially good to colonize since the ecozone (life zone) is wider than around cooler stars but they are less likely to have indigenous life. In other words, stars like the sun are the most likely to have life on their terrestrial planets.
THE 10 PARSEC MODEL DATA
Using the latest data, 12 out of 201 systems, or approximately 6%, or using known components (259), about 5% of the stars are suitable for life. Actually the percentage is probably considerably lower as there are many faint small near stars we haven’t discovered yet. These twelve stars are Sol, Zeta Tucanas, 107 Piscium, Tau Ceti, Gliese 75, 82 (e) Eridani, Chi 1 Orionis, Alpha Mensae, Beta Virginis, Beta Canum Venaticorum, Beta Comae Berenices, and 61 Virginis.
The 1968 10 parsec model contained all the then-known stars (minus one) within 10 parsecs plus additional brighter stars beyond this range to fill in the cube beyond the 10 parsec sphere. These additional stars included Zeta 1 and 2 Ret., 54 Piscium and Gliese 67. Because of these additions the pattern was found.
Stars were not scattered randomly. Stars of similar size tended to be together although there was some mixing There was a large area covering almost half the volume of the model that contained no stars suitable for life and a large part of this volume had practically no stars at all. The sun was on the edge of this area so somewhat isolated. Since the sun was supposed to be in Betty’s map, and only part of the area near the sun had suitable stars, the search was narrowed and simplified.
Originally the pattern was checked through all main sequence stars capable of having planets, including doubles which may or may not have planets. Then most of the pattern was found except Gliese 86, 59 and 111 which were beyond the range of the model and data available in 1968 and early 1969. Once the kinds of stars that made up the pattern was realized and more accurate data obtained, models that extended further than 10 parsecs were built which led to the missing stars.
BETTY’S STAR MAP AND REALITY
In referring to the actual star pattern that resembles Betty’s map, the name, Psyche, will be used. Dr. David Saunders proposed the name and Betty and I agreed enthusiastically.
Assumptions Made in Checking
- The map appeared to be made from the area near (or point of view of) the base stars. Parallax shifts would make Earth-based star maps useless. A model would be one way of handling the problem of parallax shifts.
- The sun was in the map, presumably with a line to it.
- At least one of the base stars should be able to support life. This means it should be main sequence, at least K5 or brighter, probably brighter than K1 but less than F7, since Sagan puts the probable start of intelligent life at F8.
- Since they come to the sun, stars like the sun should be equally interesting to them, at least single, nonvariable main sequence G stars, probably late F, and possibly early Ks.
- The base stars are the two large circles with the lines radiating from them.
- The travel pattern should be logical.
- Other stars suitable for planets but not life might or might not be visited so should be checked. Since there is a controversy whether multiple stars have planets or not, they should be checked.
Map Facts
- The map was 3-D.
- The stars glowed.
- The stars were tinted.
- There were no grid lines.
- There was no concentration of stars, so the galactic plane concentration of stars (Milky Way) was not apparent, probably showing (if the map represented reality) only local stars were in it. Another possibility would be that only selected stars were in it. But since they were interested in the sun, and there are a number of stars similar to the sun in the local neighborhood, Psyche, if it existed, would still be local.
- The map was about 3 feet long by 2 feet high.
- The map was similar to a reflective hologram. The map material was thin. It had no linticular lines as in one of our 3-D processes. It was not a projection.
- The map was done as a posthypnotic suggestion to be drawn only if it was not remembered accurately. She was not to pay attention to what she was drawing. This puts it in the realm of automatic drawing which can be very useful and accurate in bringing to the surface (sic) forgotten and repressed material.
Proof That the Map is not a Hoax
- No earth astronomer in 1961-1964 would have known the triangle background stars existed as a cluster in its present position because:
- The parallax (distance measurement) of 86.1 had not been taken then. Its position was printed in 1969.
- The distance of Gliese 97 was thought of as 55.2 light years which would put it beyond Gliese 111 before the
1969 catalog. - The distance of Gliese 95 was thought of as 37.5 light years (pi.087 ±11) or 35.8 light years (pi..091) before the 1969 catalog. This would move it above rather than below the line of Gliese 111.
Only correlation of several different types of parallax measurement (spectral, photometric, and trigonometric) result in the present more accurate parallaxes. Earlier catalogs usually used just one type of measurement.
The triangle would be remembered as it is very near the surface of the map and is quite prominent.
- The earlier parallax for Gliese 86 would put it at a much poorer angle.
- Variable main sequence single stars were avoided. They would be unlikely for life because it requires even heat over a long period of time to develop. The probable main sequence variable stars are marked “var?” in the Catalog of Bright Stars by Dorrit Hoffleit which was published in 1964. Betty’s experience was in 1961. The map was drawn early in 1964. It is very unlikely that she could have had access to the catalog even if she knew how to interpret it, and if it was released before she drew the map. (It took me two years to see the catalogs even though I knew what I needed generally. They are not found in normal university libraries, much less local ones, and book stores do not carry them. Some cannot even be purchased from the author.)
The fact that these main sequence single F5-G-K1 stars are probable variables was not caught by astronomers who specialize in stars that might have planets with life, even in recent books. Delta and Gamma Pavonis, Sigma Draconis, Beta Hydrus etc. are some of the stars listed as good for life, but which are really probable variables. This shows the map maker knew variables should be avoided and which stars were variable.
- Many exobiology books list doubles as suitable for planets with life. Kuiper s work showing that planets are not likely to develop in a multiple system was published in 1955, but it is apparently not well known. Even if multiple stars can have planets, circular orbits in the ecosphere would be difficult to maintain. Normal doubles were avoided in the lined portion of Psyche.
Epsilon Eridani was announced to be a multiple system in March 1973 by Dr. Peter van de Kamp. Its companion is halfway between a planet and a star in mass. It was avoided in Psyche, although it is near Tau Ceti and the sun. Before 1973 exobiologists considered Epsilon Eridani one of the best prospects for life, and it was part of the Ozma study. The mapmaker knew it should be avoided long before we did.
Proof that the Similarity Between Betty’s Map and Reality is not Coincidental
- The top and bottom surface of the depth of Psyche are squares. The height of the map is 2/3 the size of the square. It is highly improbable that this could be coincidental.
- The lines represent a logical travel pattern to investigate all the best stars for life from Zeta Reticuli, best star for life to the next best (closest) star for life to the next closest, etc.
- The double dotted line to Tau Ceti represents two expeditions. Two expeditions were likely, the first to 82 Eridani to Tau Ceti to Earth, since the sun is closer to Tau Ceti than 107 Piscium is to Tau Ceti. The dotted (expedition) line to the sun was dropped when the solid line directly from Zeta Reticuli was put in, just as all the dotted lines were dropped when solid lines were put in to 82 Eridani, Alpha Mensae and Gliese 86. The second expedition went from 82 Eridani to Tau Ceti, then in the opposite direction from Earth to 107 Piscium.
- Only the best stars for life are used. These are non-variable main sequence stars, F6-G-K1, absolute magnitude 3.7 to 5.9. To show the proportions of these stars to all stars, the stars within the volume of a sphere with a radius of 10 parsecs (32.59 light years) was used. There are twelve such stars compared with 201 known systems and 259 known components in this volume. This gives a ratio of 1/17 and 1/21 respectively. I spent over six months checking all possible combinations using all kinds of main sequence stars F2 and dimmer, including doubles, in the 10 parsec model. The only one that resembled Betty’s map was that part of Psyche within the model. Since the-best-stars-for-life ratio is so small compared to stars in general, it is hardly coincidental that the only pattern like Betty’s should be made up solely of these stars.
- All the stars suitable for life in the Psyche volume are included in Betty’s drawing.
DISCREPANCIES
The background stars, with the exception of the triangle which has relatively bright stars near the surface of the map, were put in just to show there were background stars. These probably do not represent individual stars.Betty concentrated on the stars connected with lines. There are over 100 stars in the Psyche volume.
Betty saw the lined pattern as a whole and the triangle as a whole but did not draw them to the same scale.
The line to Alpha Mensae is an extension of the Gliese 86-Zeta Reticuli line. On this line, her conscious mind took control. She erased twice and put it in wrong. A projected image of a slide of the model on a tracing of Betty’s map shows the correct line was probably the top erased line, although the lower erased line is closer to the correct line length. Correcting this angle also corrects the angle to Alpha Mensae.
If the top erased line is used, the angle made by the two base stars does not quite correspond. This is an error in the model, not Betty’s map. Zeta Reticuli 2 actually is more to the right from this viewing angle. They were using a much larger scale. There is a visual separation of about 1/20 light year if they are 36.6 light years away. On the largest scale I’ve used so far, 1/4” per light year, this move to the right can’t be shown. (actually they may be over 1 light year apart as parallax measurements out that far are not too accurate). The two base stars are very near the map’s surface, and using a much larger scale, their separation would be dramatized.
There are slight differences in line length and angles as in any freehand drawing. Compare for yourself the projected slide of the model on Betty’s drawing.
CONCLUSION
Since we did not have the data to make such a map in 1961 when Betty saw it, or in 1964 when she drew it, it could not be a hoax. Since the stars with lines to them are such a select group, it is almost impossible that the resemblance between Betty’s map and reality could be coincidental. Betty’s map could only have been drawn after contact with extraterrestrials.
Figure 1: ID of Stars in Model
Figure 2: Betty Hill’s Map minus background stars
Figure 3: Betty’s map with a slide of the model projected on it.
Figure 4: The space volume similar to Betty Hills map, psyche
PARTIAL LIST OF STAR CATALOGS USED:
Aitken, Robert G., 1935. The Binary Stars; McGraw-Hill.
Batten, Alan H., 1967. Sixth Catalogue of the Orbital Elements of Spectroscopic Binary Systems, Publications of the Dominion Astrophysical Observatory, Victoria, B.C., Volume XIII No. 8, Canada Department of Energy, Mines and Resources, Observatories Branch.
Gliese, W., 1957. Katalog der Stern Näher als 20 Parsek für 1950.0.
- Catalogue of Nearby Stars, Edition 1969 Veroffentlichungen des Astronomishen Rechen-Institute, Heidelberg Nr. 22 Verlag G. Braun, Karlsruhe
Hoffleit, Dorrit, 1964. Catalogue of Bright Stars, data compiled through 1962, Third Revised Edition, Yale University Observatory, New Haven, Connecticut.
Jaschek, Carlos, Conde, Horacio, y de Sierra, Amelia C., 1964. Catalogue of Stellar Spectra Classified in the Morgan-Keenan System; Observatorio Astronomico de la Universidad Nacional de la Plata. Serie Astronomica XXVIII (2)
Jenkins, Louise F., 1963. General Catalogue of Trigonometric Stellar Parallaxes, Yale University Observatory, New Haven, Connecticut.
Van de Kamp, Peter. Lists of stars within 5 parsecs.
Marjorie Fish
The Hill Sketch
Marjorie E. Fish first became interested in UFO’s in 1966 while reading “Anatomy of a Phenomenon” by Dr. Jacques Vallee. Her interest in UFO’s was intense because of her prior studies of anthropology, biology, psychology, and animal behavior. Alternate ways of living, thinking, perceiving, and differences in biological systems are fascinating to Miss Fish, and integrating them into an understandable whole is an important avocation. She believes that extraterrestrial life forms and civilizations could give us a real “mirror for man,” a comparison that could possibly answer many of the questions that have baffled man through the ages, questions of our nature, biology, and philosophy, which we are too close to to see the answers.
Marjorie Fish was born in Cleveland, Ohio, on September 19, 1932. She received a B.S. degree in Sociology from Juniata College in Huntingdon, Pennsylvania, in 1954, graduating with distinction. She minored in Science. Miss Fish retrained for Elementary Education at Bowling Green State University in Bowling Green, Ohio, from June of 1962 to August of 1964.
Miss Fish has been teaching school in the state of Ohio for eleven years. She is affiliated with the Unitarian Church. Her hobbies and general interests are varied: reading, photography, art, carpentry, gardening, crafts, music, anthropology, ancient civilizations, astronomy, botany, mythology, psychological research, and zoology Her unique three-dimensional model of the near stars is now being used by the Astronomy Department at Ohio State University at Perkins Observatory in Delaware, Ohio. Miss Fish spent six years in intensive research of the near stars and factors necessary for life.
Miss Fish’s address is P. 0. Box 128, Oak Harbor, Ohio 43449.
CHRONOLOGY
IDENTIFICATION OF THE STARS IN THE MODEL
| Gliese No. | Name | |
| 1.
2. |
136 138 17 231 139 |
Zeta Reticuli 1 Zeta Reticuli 2 Zeta Tucanae Alpha Mensae Sun 82 Eridani, e Eridani Tau Ceti 107 Piscium 54 Piscium BSC 2050 GC 2610 Tau 1 Eridani GC 1883 HD13435 GC2794 Kappa Fornacis |
BETTY HILL’S MAP MINUS BACKGROUND STARS
BETTY’S MAP WITH A SLIDE OF THE MODEL PROJECTED ON IT
– – Betty’s drawing
xxx Lines Betty erased
– . – Photo of the Model with lines drawn to connect the beads
THE SPACE VOLUME SIMILAR TO BETTY HILL’S MAP, PSYCHE
X = Betty’s viewing position
ABCD = The map surface
ABFE = and DCGH are squares with sides 48 light years + or – <1 light year long.
AD and BC are 32 light years + or – <1 light year long.
COORDINATES FOR THE VOLUME
| A B C D E F G H |
3 7 23 1 1 13 18 23 |
24 4 24 13 49 0 26 8 |
-11 -50 -76 -24 +44 +34 -7.5 +19.3 |
53.3 38 44 57.4 42 17 27.8 47.3 |
This web page was created by Francis Ridge & Tom Deuley for the NICAP

